17.3 GENETIC LINKAGE AND RECOMBINATION
Mendel was fortunate not only because peas do not possess sex chromosomes, but also because the genes that influenced the traits he studied, such as round/wrinkled and green/yellow seeds, were on separate chromosomes or far apart on the same chromosome. What happens when genes are close to each other in the same chromosome? We explore the answer to this question in this section.
17.3.1 Nearby genes in the same chromosome show linkage.
Genes that are sufficiently close together in the same chromosome are said to be linked. That is, they tend to be transmitted together in inheritance and do not assort independently of each other as Mendel observed. Note that linked genes refer to two genes that are close together in the same chromosome, which may be an autosome or sex chromosome. This is not to be confused with an X-linked gene, which is simply one that is present in the X chromosome.
17-9
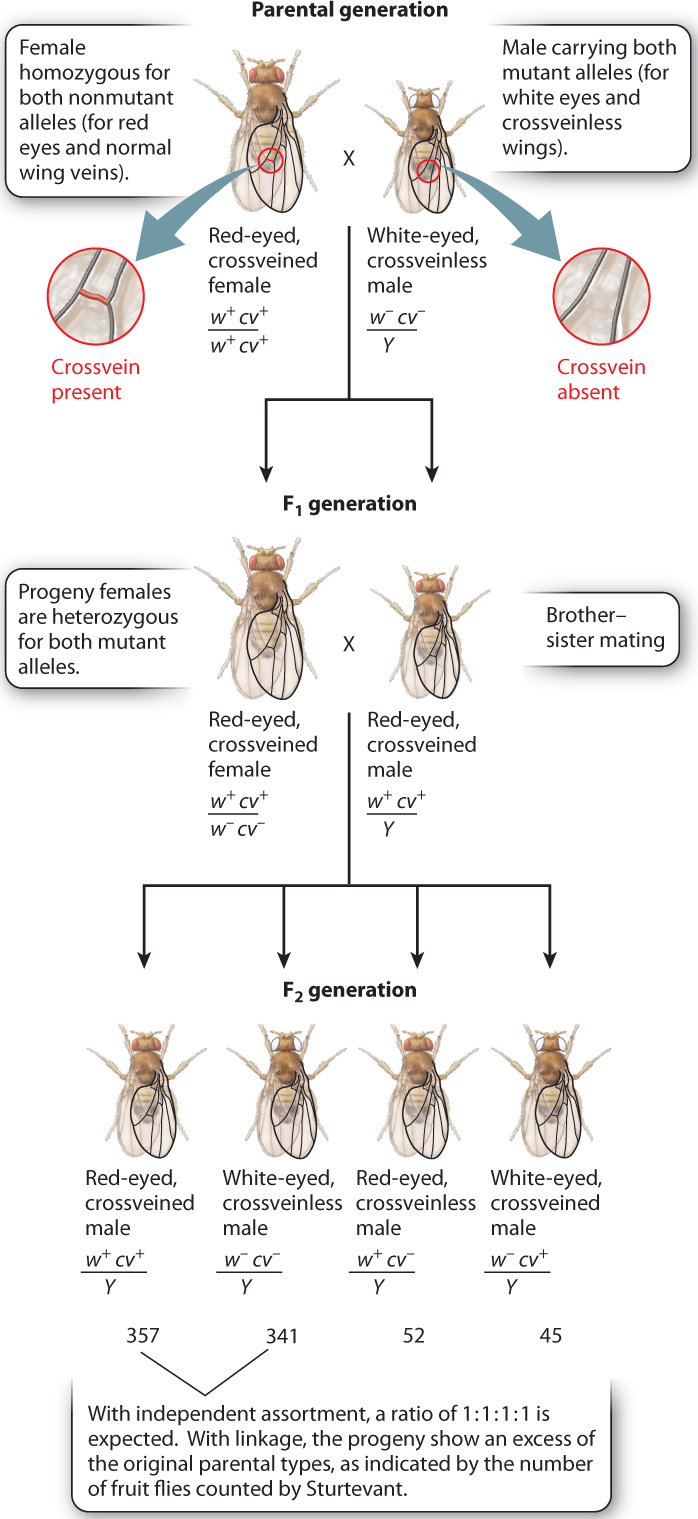
Linkage was discovered in Drosophila by Alfred H. Sturtevant, another of Morgan’s students. Once again, genes in the X chromosome played a key role in the discovery, as seen in Fig. 17.9. Sturtevant worked with male fruit flies that have an X chromosome carrying two recessive mutations. One is in the white gene (w) discussed earlier, which when nonmutant results in fruit flies with red eyes and when mutant results in fruit flies with white eyes. The other recessive mutation is in a gene called crossveinless (cv), which when nonmutant results in fruit flies with tiny crossveins in the wings and when mutant results in the absence of these crossveins.
Sturtevant crossed this doubly mutant male with a female carrying the nonmutant forms of the genes (w+ and cv+) in both X chromosomes. He saw that the offspring consist of phenotypically wild-type females that are heterozygous for both genes, and phenotypically wild-type males. When these are crossed with each other, the female F2 progeny do not tell us anything because they are all wild type; each female receives the w+cv+X chromosome from her father and therefore has red eyes and normal crossveins. In the male F2 progeny, the situation is different: Each male progeny receives its X chromosome from the mother and its Y chromosome from the father, and so the phenotype of each male immediately reveals the genetic constitution of the X chromosome that the male inherited from the mother.
As shown in Fig. 17.9, the male F2 progeny consist of four types:
| Genotype of F2 progeny | Number of fruit flies |
| w+cv+/Y (red eyes, normal crossveins) | 357 |
| w−cv−/Y (white eyes, missing crossveins) | 341 |
| w+cv−/Y (red eyes, missing crossveins) | 52 |
| w−cv+/Y (white eyes, normal crossveins) | 45 |
Although all four possible classes of maternal gametes are observed in the male progeny, they do not appear in the ratio 1:1:1:1 expected when gametes contain two independently assorting genes (Chapter 16). The lack of independent assortment means that the genes show linkage.
The male progeny fall into two groups. One group, represented by fewer numbers of progeny, consists of w+cv− and w−cv+ combinations of alleles. These are called recombinants, and they result from a crossover, the physical exchange of parts of homologous chromosomes, which takes place in prophase I of meiosis (Chapter 11). The other group of male progeny derives from maternal gametes containing either w+cv+ or w−cv−. These gametes each carry a chromosome that contains the alleles in the same combination as in one of the chromosomes in the mother. The w+cv+ and w−cv− combinations are therefore called nonrecombinants (that is, the alleles are present in the same combination as that seen in the parent).
17-10
Fig. 17.10 shows how recombinant and nonrecombinant chromosomes arise, using the hypothetical linked genes A and B. In a cell undergoing meiosis in which a crossover takes place between the linked genes, the allele combinations are broken up in the chromatids involved in the exchange, and the resulting gametes are AB, Ab, aB, and ab. In Fig. 17.10a, the Ab and aB gametes have undergone recombination: The allele combinations that were originally together in each chromosome (A with B and a with b) have recombined (A with b and a with B) in the chromosomes that participated in the crossover.
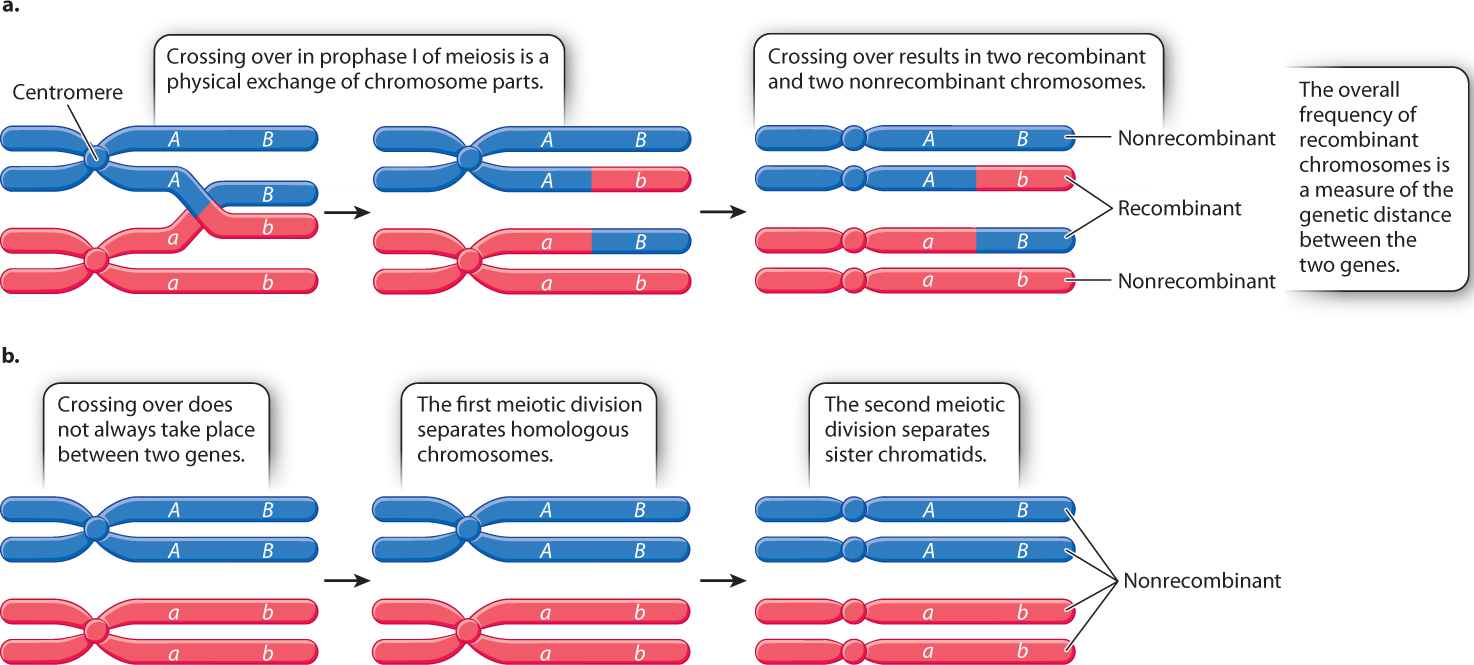
Note that crossing over does not just result in recombinant chromosomes. Fig. 17.10a shows that, even when a crossover occurs in the interval between the genes, two of the resulting chromosomes contain the nonrecombinant configuration of alleles. These nonrecombinant configurations occur because crossing over occurs at the four-strand stage of meiosis (when each homologous chromosome is a pair of sister chromatids), but only two of the four strands (one sister chromatid from each homologous chromosome) are included in any crossover.
Fig. 17.10b shows a second way in which nonrecombinant chromosomes originate. When genes are linked, some cells undergoing meiosis do not undergo a crossover in the interval between the genes. In this case, the AB combination of alleles in one chromosome and the ab combination of alleles in the homologous chromosome both remain intact, and the gametes produced are AB and ab.
17.3.2 Recombination frequency is a measure of the distance between linked genes.
When two genes are on separate chromosomes, a ratio of 1:1:1:1 is expected for the nonrecombinant (parental) and recombinant (nonparental) gametic types (Chapter 16). For two genes present in the same chromosome, we can consider two extreme situations. If they are located very far apart from each other, crossing over will certainly occur, and there will be a 1: 1:1:1 ratio of nonrecombinant and recombinant gametes (as shown in Fig. 17.10a). At the other extreme, if two genes are so close together that crossing over never takes place between them, we would expect only nonrecombinant chromosomes (Fig. 17.10b).
What happens in between these extremes? In these cases, the nonrecombinant chromosomes in the offspring are more numerous than the recombinant chromosomes, as we saw with w and cv (see Fig. 17.9). The frequency of recombinants depends on the distance between the genes. The closer, or more tightly linked, that two genes are to each other, the smaller the frequency of recombinants among the progeny. The distance between the genes is important because whether or not a crossover occurs between the genes is a matter of chance, and the closer the genes are along the chromosome, the less likely it is that a crossover will take place in the interval between them. Because the formation of recombinant chromosomes requires a crossover between the genes, genes that are close together show less recombination than genes that are far apart. In fact, the proportion of recombinant chromosomes observed among the total, which is called the frequency of recombination, is a convenient measure of distance between the genes along the chromosome.
17-11
In the example with the genes w and cv, the total number of chromosomes observed among the progeny is 357 + 341 + 52 + 45 = 795, and the number of recombinant chromosomes is 52 + 45 = 97. The frequency of recombination between w and cv is therefore 97/795 = 0.122, or 12.2%, and this serves as a measure of distance between the genes. In studies of genetic linkage, the distance between genes is not measured directly by physical distance between them, but rather by the frequency of recombination.
The frequency of recombination between any two genes ranges from 0% (when crossing over between the genes never takes place) to 50% (when the genes are so far apart that crossing over between the genes always takes place). Genes that are linked have a recombination frequency somewhere between 0% and 50%.
Question Quick Check 2
kzYIOLBR4iP3BmCoEmH275rwglIq8NeVg4DNKrONxJrIZs4yj63DnyxGhUHuGgIjUnnWVuri5wIw6y9PpzlU60Ovs+g=Recombination plays an important role in creating new combinations of alleles in each generation and in ensuring the genetic uniqueness of each individual. If there were no recombination (that is, if all the alleles in each chromosome were completely linked), any individual human would be able to produce only 223 = 8.4 million types of reproductive cells. While this is a large number, the average number of sperm per ejaculate is much larger—approximately 350 million. Because recombination does occur, and because the crossovers resulting in recombination can occur at any of thousands of different positions in the genome, each of the 350 million sperm is virtually certain to carry a different combination of alleles.
17.3.3 Genetic mapping assigns a location to each gene along a chromosome.
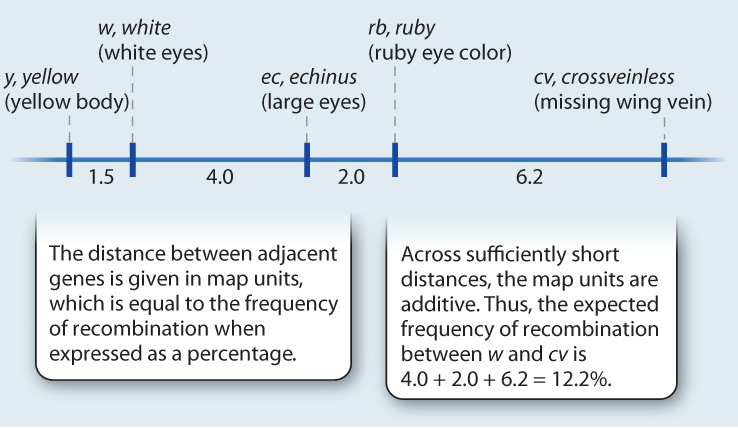
With the exception of a few regions, such as the area near the centromere, the likelihood of a crossover occurring somewhere between two points on a chromosome is approximately proportional to the length of the interval between the points. Therefore, the frequency of recombination can be used as a measure of the physical distance between genes. These distances are used in the construction of a genetic map, which is a diagram showing the relative position of genes along a chromosome. The maps are drawn using a scale in which one unit of distance (called a map unit) is the distance between genes resulting in 1% recombination. Thus, in a Drosophila genetic map containing the genes w and cv, the distance between the genes is 12.2 map units.
Genetic maps are built up step by step as new genes are discovered that are genetically linked with known genes, as shown in Fig. 17.11. Across distances that are less than about 15 map units, the map distances are approximately additive, which means that the distances between adjacent genes can be added to get the distance between the genes at the ends. For example, in Fig. 17.11, there are two genes between w and cv. The map distance between w and the next gene, ec, is 4.0, the distance between ec and the next gene, rb, is 2.0, and the distance between rb and cv is 6.2. The map distance between w and cv is therefore 4.0 + 2.0 + 6.2 = 12.2 map units, and hence the expected frequency of recombination between these genes is 12.2%, which is the value observed.
FIG. 17.11: Can recombination be used to construct a genetic map of a chromosome?
BACKGROUND In 1910, Thomas Hunt Morgan discovered X-linkage by studying the white-eye mutation in Drosophila. Soon other X-linked mutations were found. Alfred H. Sturtevant, Morgan’s student, decided to test whether mutant genes in the same X chromosome were inherited together, that is, linked. He found that genes in the X chromosome were linked, but not completely, and that different pairs of genes showed great differences in their linkage. Some genes showed almost no recombination, whereas others underwent so much recombination that they showed independent assortment.
HYPOTHESIS Sturtevant hypothesized that recombination was due to crossing over between the genes, and that genes farther apart in the chromosome would show more recombination.
EXPERIMENT Taking this idea a step further, Sturtevant reasoned that if one knew the frequency of recombination between genes a and b, between b and c, and between a and c, then one should be able to deduce the order of genes along the chromosome. He also predicted that, if the order of genes were known to be a–b–c, then if the genes were close enough, the frequency of recombination between a and c should equal the sum of the frequencies between a and b and that between b and c.
RESULTS Sturtevant studied the frequencies of recombination between many pairs of genes along the X chromosome, including some of those shown in the accompanying illustration.
CONCLUSION The results confirmed Sturtevant’s hypothesis and showed that genes could be arranged in the form of a genetic map, depicting their linear order along the chromosome, with the distance between any pair of genes proportional to the frequency of recombination between them. Across sufficiently short regions, the frequencies of recombination are additive.
FOLLOW-UP WORK Genetic mapping remains a cornerstone of genetic analysis, showing which chromosome contains a mutant gene and where along the chromosome the gene is located. The method helped to identify the genes responsible for many single-gene inherited disorders, including Huntington’s disease, cystic fibrosis, and muscular dystrophy.
SOURCE Sturtevant, A. H. 1913. “The Linear Arrangement of Six Sex-Linked Factors in Drosophila, as Shown by Their Mode of Association.” Journal of Experimental Zoology 14: 43–59.
However, for two genes that are farther apart than about 15 map units, the observed recombination frequency is somewhat smaller than the sum of the map distances between the genes. The reason is that, with greater distances, two or more crossovers between the genes may occur in the same chromosome, and thus an exchange produced by one crossover may be reversed by another crossover farther along the way.
Question Quick Check 3
MQxsrONcmYjEd+wM5octaROiWjlneLkh4lMFUKA+TTXU4VxAm6V8jE029YNP8GNMhAmPKwAIqdF7OXU0oiArACcjFl8E2mAMRnM5K+hfqhJgONCP6w3YggMflOM=17.3.4 Genetic risk factors for disease can be localized by genetic mapping.
The discovery of abundant genetic variation in DNA sequences in human populations, such as single-nucleotide polymorphisms (Chapter 15), made it possible to study genetic linkage in the human genome. At first, the focus was on finding mutations that cause disease, such as a mutation that causes cystic fibrosis (Chapter 14). The method was to study large families extending over three or more generations in which the disease was present and then to identify the genotypes of each of the individuals for thousands of genetic markers (previously discovered DNA polymorphisms) throughout the genome. The goal was to find genetic markers that showed a statistical association with the disease gene, which would indicate genetic linkage and reveal the approximate location of the disease gene along the chromosome.
17-12
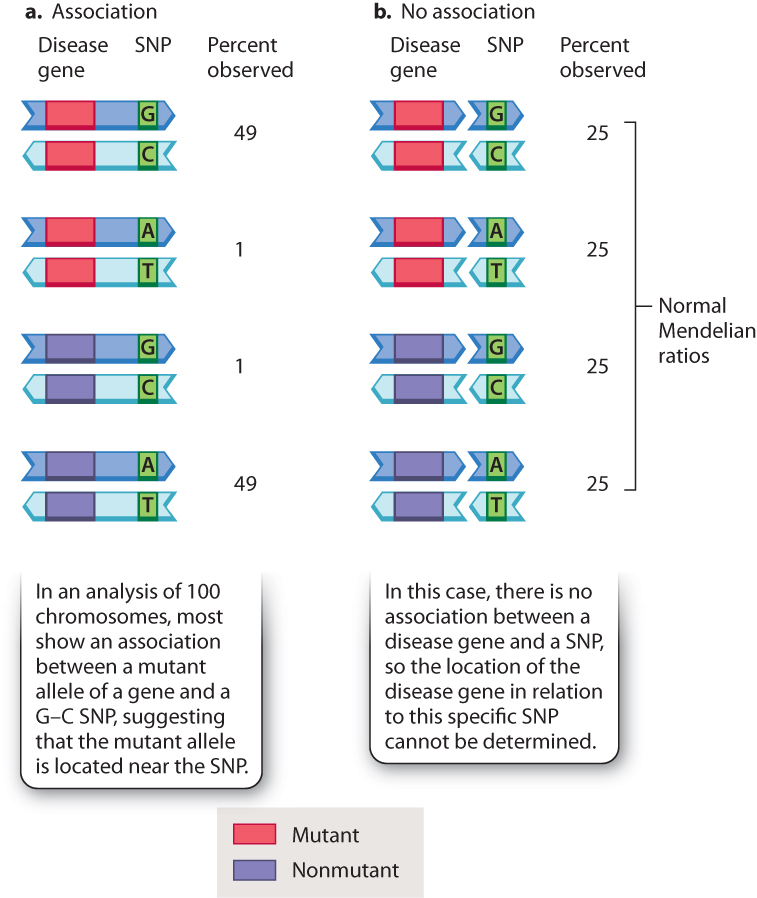
Fig. 17.12 illustrates the underlying concept. It assumes 100 chromosomes observed among different individuals in a pedigree, of which 50 carry a mutant allele of a gene and 50 carry a nonmutant allele. These chromosomes are tested for a marker of known location, in this case a single-nucleotide polymorphism (SNP) in which one of the nucleotide pairs in the DNA is a G–C base pair in some chromosomes and A–T in others. In Fig. 17.12a, there is clearly an association between the disease gene and the SNP. Almost all of the chromosomes that carry the mutant allele show the G–C nucleotide pair, whereas almost all of the chromosomes that carry the nonmutant allele show the A–T nucleotide pair. The two chromosomes in which the mutant and nonmutant genes are associated with the other SNPs can be attributed to recombination.
The association in Fig. 17.12a may be contrasted with the pattern in Fig. 17.12b, in which there is no association. In this case, each of the alleles of the disease gene is equally likely to carry either form of the SNP. The failure to find an association means that the SNP is not closely linked to the disease gene, and may actually be in a different chromosome. In actual studies, an association is almost never observed, but the lucky find of an association helps identify the location of the disease gene in the genetic map. Using such association methods, hundreds of important disease genes have been located by genetic mapping. Once the location of the disease gene is known, the identity and normal function of the gene can be determined.
17-13