18.2 RESEMBLANCE AMONG RELATIVES
Mendel had many advantages over Galton in his studies of inheritance. Mendel’s peas were true breeding, produced a new generation each year, and yielded large numbers of progeny. The environment had a negligible effect on the traits, and the genetic effect on each trait was due to the alleles of a single gene. Mendel’s crosses yielded simple ratios such as 3:1 or 1:1, which could be interpreted in terms of segregation of dominant and recessive alleles.
By contrast, Galton studied variation in such traits as height in humans. Humans are obviously not true breeding and have few offspring. Galton had one big advantage, though: Whereas most simple Mendelian traits are relatively uncommon, Galton’s traits are readily observed in everyday life. What did Galton discover?
18.2.1 For complex traits, offspring resemble parents but show regression toward the mean.
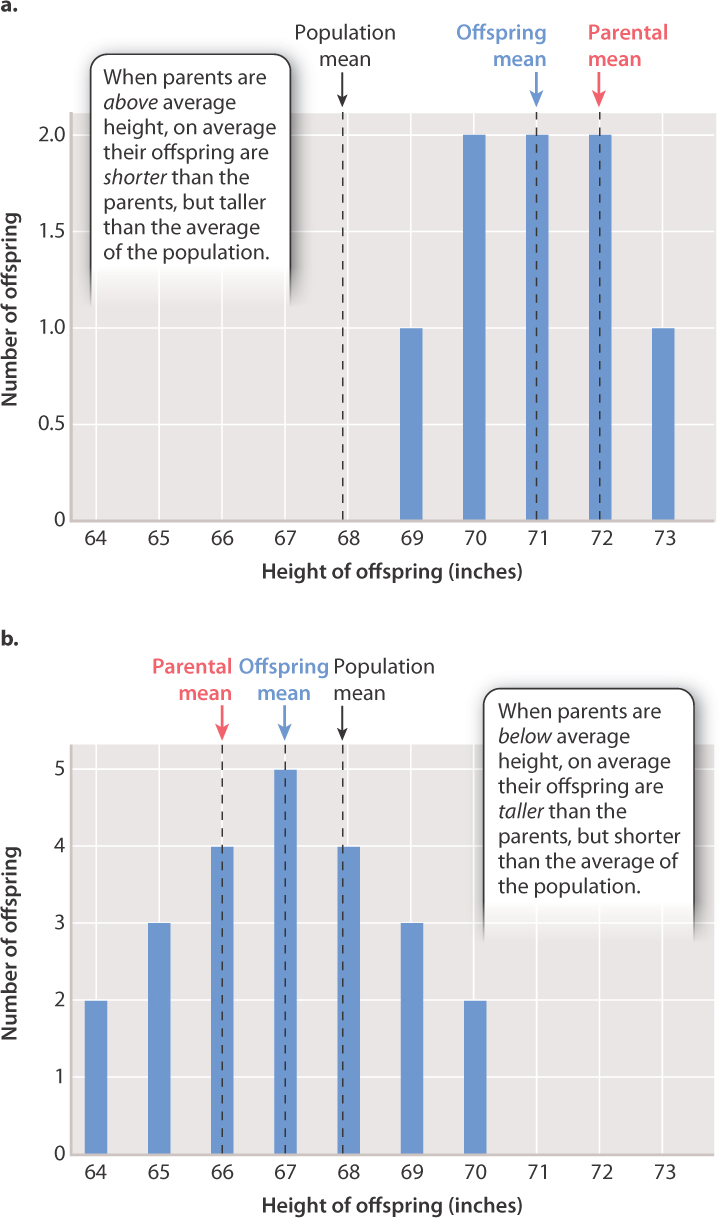
Galton studied many complex traits, including human height, strength, and various physical characteristics, including number of fingerprint ridges. The discovery he regarded as fundamental resulted from his data on adult height of parents and their progeny (Fig. 18.7). Galton noted that each category of parent (tall parents or short parents) produced a range of progeny forming a distribution with its own mean. He also noted that the mean height of the progeny of tall parents was taller than the average height in the entire population but shorter than that of the parents. Finally, he noted that the mean height of the progeny of short parents was shorter than the population average but taller than that of the parents.
The bar graph in Fig. 18.7a shows the distribution of height among the progeny of the tallest parents, whose average height is 72 inches. The mean height of the offspring is 71 inches, which is greater than the mean height of the whole population of the study (68.25 inches) but less than that of the parents. The bar graph in Fig. 18.7b is the distribution of height of progeny of the shortest parents, who averaged 66 inches. In this case, the mean height of the progeny is 67 inches, which is less than the mean height of the population but greater than that of the parents. Note, however, that some of the offspring of tall parents are taller than their parents, and likewise some of the offspring of short parents are shorter than their parents. It is only on average that the height of the offspring is less extreme than that of the parents.
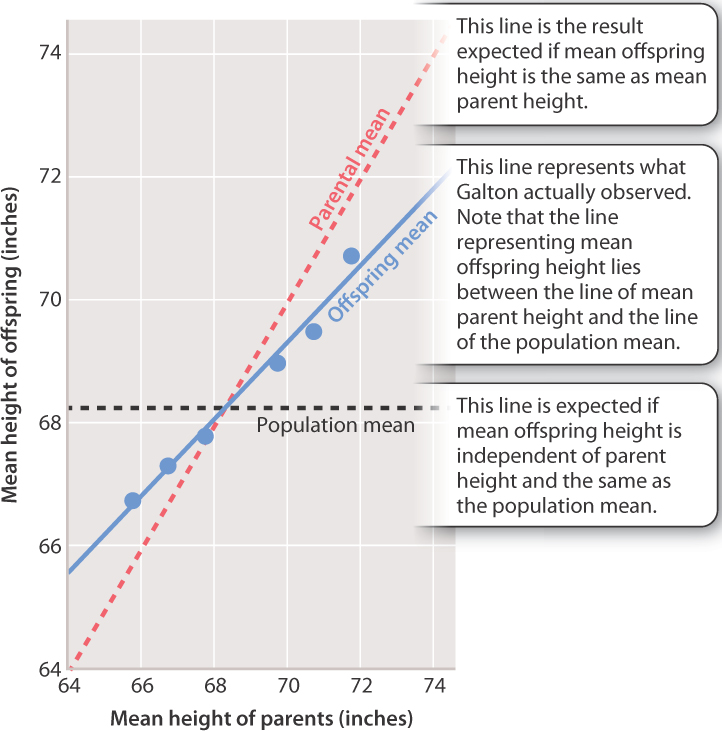
Galton’s analysis led him to the trend shown in Fig. 18.8. The graph plots the average height of parents and the average height of their progeny across the whole range of heights observed. Consider two cases. If the mean parent height is 72 inches (above the mean height in the population as a whole), the mean offspring height is less than the mean parent height but more than the population average. By contrast, if the mean parent height is 66 inches (below the mean height in the population), the mean offspring height is more than the mean parent height but less than the population average.
Galton regarded this observation as his most important discovery, publishing his results in 1886, and today we call it regression toward the mean. The offspring exhibit an average phenotype that is less different from the population mean than that of the parents. In other words, when the average height of the parents is smaller than the population mean, then the average height of the offspring is greater than that of the parents (but smaller than the population mean). Likewise, when the average height of the parents is greater than the population mean, then the average height of the offspring is smaller than that of the parents (but greater than the population mean).
18-7
Regression toward the mean is observed for two reasons. The first is that during meiotic cell division (Chapter 11), segregation and recombination break up combinations of genes that result in extreme phenotypes, such as very tall or very short, that are present in the parents. The second reason is that the phenotype of the parents results not only from genes but also from the environment. Environmental effects are not inherited, so to the extent the parents’ phenotypes result from environmental effects, the same phenotypes will not necessarily appear in the offspring.
Question Quick Check 1
JITsMxDH1BJIdxHZc6/PK+TzQJvx3185uSOOLLoLFAwp5kQsRssfh3A3LehArs8+dttN3/nwgFbvKQTHpmt6MGgrU6+YwVGfB9vFWQw1Jg19fX098lyOhFB+dLk7Gn0H7Kv0eg==18.2.2 Heritability is the proportion of the total variation due to genetic differences among individuals.
How much of the difference in height among individuals is due to genetic differences, and how much is due to environmental differences? The slope of the line that relates the average phenotype of parents to the average phenotype of their offspring (the blue line in the graph in Fig. 18.8) can answer this question because it provides a measure of the heritability of the trait. The heritability of a trait in a population of organisms is the proportion of the total variation in the trait that is due to genetic differences among individuals. For a complex trait, the heritability determines how closely the mean of the progeny resembles that of the parents.
When heritability is 100%, all of the variation among individuals in the population is due to differing genotypes, and in this case the mean phenotype of the offspring is identical to that of the parents. If height had a heritability of 100%, then the blue line in Fig. 18.8 would be the same as the line representing the parental mean (the dashed red line). In contrast, when the heritability of a trait is 0%, all of the variation in the trait in a population is due to differences in environment, and in this case the mean phenotype of offspring would have no resemblance to that of their parents. In Fig. 18.8, if the heritability of height were 0%, then the blue line would be superimposed on the horizontal line depicting the population mean (the dashed black line).
The term “heritability” is often misinterpreted. The problem is that, in non-scientific contexts, the word means “the capability of being inherited or being passed by inheritance.” This definition suggests that heritability has something to do with the inheritance of a trait. But “heritability” as used for complex traits means no such thing. It refers only to the variation in a trait among individuals, and specifically to the proportion of the variation among individuals in a population due to differences in genotype.
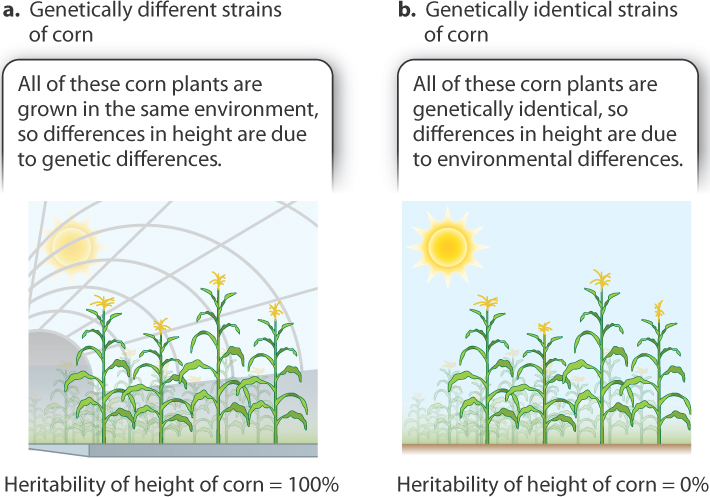
Hence, a heritability of 100% does not imply that the environment cannot affect a trait. As emphasized earlier, the environment is always important, just as oxygen is important to life. What a heritability of 100% means is that variation in the environment does not contribute to differences among individuals in a specific population. For example, if genetically different strains of corn are grown in a greenhouse and subject to identical environmental conditions, then differences in height have to be due to genetic differences, and the heritability of the trait would be 100% (Fig. 18.9a). Similarly, a heritability of 0% does not imply that genotype cannot affect the trait. A heritability of 0% merely means that differences in genotype do not contribute to the variation in the trait among individuals in a specific population. If genetically identical strains of corn are grown in different environments, then differences in height must be due to the environment, and heritability would be 0% (Fig. 18.9b).
18-8
The magnitude of heritability therefore is not an intrinsic property of a trait. For corn height, as we have seen, the heritability in one case was 100% and in the second 0%. Heritability applies only to the trait in a particular population across the range of environments that exist at a specific time. Similarly, the heritability depicted by the slope of the blue line in Fig. 18.8 applies only to the population studied (205 pairs of British parents and their 930 adult offspring, in the late nineteenth century), and may be larger or smaller in different populations at different times. In particular, the magnitude of the heritability cannot specify how much of the difference in average phenotype between two populations is due to genotype and how much due to environment.
If the heritability of a trait can change depending on the population and the conditions being studied, why is it a useful measure? Heritability is important in evolution, particularly in studies of artificial selection, a type of selective breeding in which only certain chosen individuals are allowed to reproduce (Chapter 21). Practiced over many generations, artificial selection can result in considerable changes in morphology or behavior or almost any trait that is selected. The large differences among breeds of pigeons and other domesticated animals prompted Charles Darwin to point to artificial selection as an example of what natural selection could achieve. Heritability is important because this quantity determines how rapidly a population can be changed by artificial selection. A trait with a high heritability responds rapidly to selection, whereas a trait with a low heritability responds slowly or not at all.
Question Quick Check 2
4xfU0fO9LaukyqLE3ZII247VFW6HjO0/81bajdoItUocxTGCYAMw5HMS4AS8/+vdZNQpeSb/tPuI/AhQfH6V/BXdSe6XToJRMCgg5iRvny4ysK7fv121Pdcd1L5pRrCTVx9yjxadwXi30+MJ2aZ5eGVXTvCIBiJbUnb5YgtmVi99NAikIyc7Bjs5Ww5yzUO+XV8ykMcY+bniKn+mLN0U3WSsxjmXIkXKShA/TxU0deSnIRNB0ldevQJ76gSOAl3dPOPcrsU3CQcYf1cPMi2rHk4ud53umHMh0DkBWGN4qR775U0N5m9ARNLKW0fNDio29X5bD4l9vTo=Let’s consider some possibilities, some true, some false.
- A. In the development of fingerprint ridges in the embryo, genes play a predominant role.
- B. In the development of fingerprint ridges in the embryo, the environment plays only a minor role.
- C. Differences in the number of fingerprint ridges among individuals are determined largely by differences in genotype.
- D. Differences in the number of fingerprint ridges among individuals are almost unaffected by differences in the environment.
- E. The average number of fingerprint ridges in the offspring is not much different from the average number of fingerprint ridges in the parents.
- F. The average number of fingerprint ridges in the offspring is almost unrelated to the average number of fingerprint ridges in the parents.
Statements a and b are false no matter what the heritability because heritability refers to differences (variation) among individuals and not to the phenotype of any one individual.
High heritability implies that statements c, d, and e are all correct. Statement f is false because such a trait would have a low heritability.