23.1 READING A PHYLOGENETIC TREE
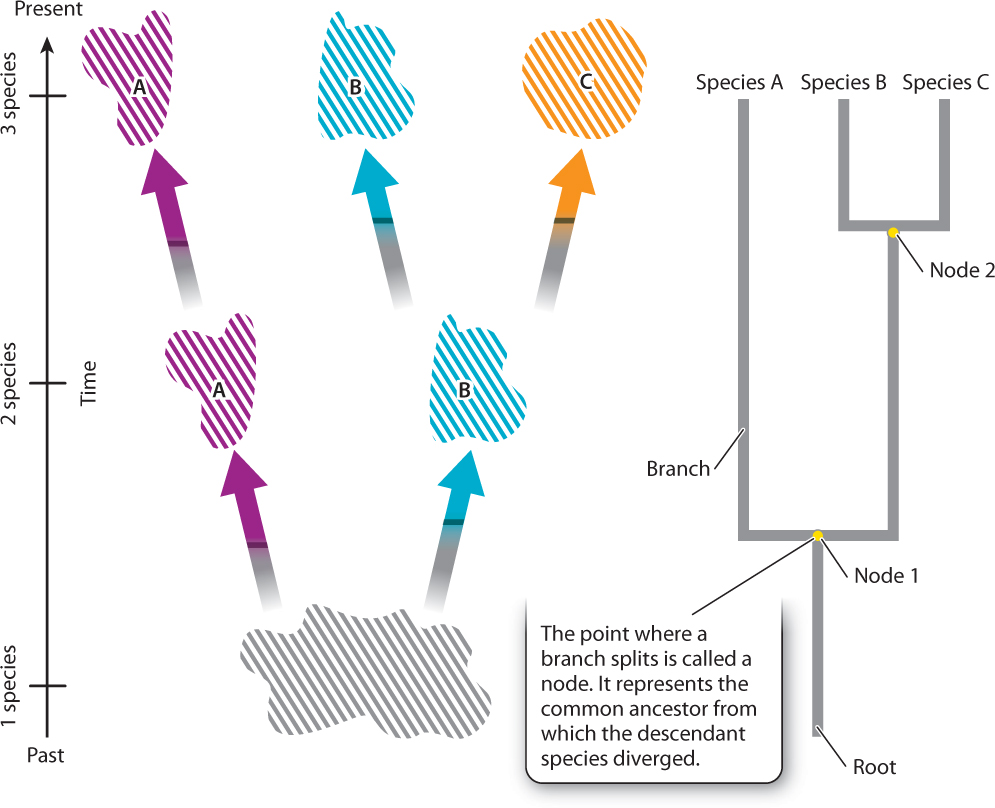
Chapter 22 introduced the concept of speciation, the set of processes by which physically, physiologically, or ecologically isolated subsets of a population diverge from one another to the point where they can no longer produce fertile offspring. As illustrated in Fig. 23.1, speciation can be thought of as a process of branching. Now consider what happens as this process occurs over and over in a lineage through time. As species proliferate, their evolutionary relationships to one another unfold in a treelike pattern, with present-day species as the tips of branches and their last common ancestors indicated by the point (called a node) from which they branched off.
23-2
23.1.1 Phylogenetic trees provide hypotheses of evolutionary relationships.
Phylogenetics is one of two related disciplines in systematics, the study of evolutionary and genetic relationships among organisms. The other is taxonomy, the classification of organisms.
The aim of taxonomy is to recognize and name groups of individuals as species, and, subsequently, to group closely related species into the more inclusive taxonomic group of the genus, and so on up through the taxonomic ranks—species, genus, order, class, phylum, kingdom, domain. Taxonomy, then, provides us with a hierarchical classification of species in more and more inclusive groups, giving us a convenient way to communicate information about the features each group possesses. So, if we want to tell someone about a small animal we have seen with fur, mammary glands, and extended finger bones that permit it to fly, we can give them this long description, or we can just say we saw a bat (or, a member of the Order Chiroptera. All the rest is understood (or can be looked up in a reference).
Phylogenetics, on the other hand, aims to discover the pattern of evolutionary relatedness among groups of species or other groups by comparing their anatomical or molecular features, and to depict these relationships as a phylogenetic tree. A phylogenetic tree is a hypothesis about the evolutionary history, or phylogeny, of the species. Phylogenetic trees are hypotheses because they represent the best model, or explanation, of the relatedness of organisms on the basis of all the existing data. However, as with any model or hypothesis, new data may require adjustments to the pattern of the tree. Many phylogenetic trees explore the relatedness of particular groups of individuals, populations, or species. We may, for example, want to understand how wheat is related to other, non-commercial grasses, or how pathogenic populations of Escherichia coli relate to more benign strains of the bacterium. At a much larger scale, universal similarities of molecular biology indicate that all living organisms are descended from a single common ancestor. This means that we can attempt to build a phylogenetic tree for all species, commonly referred to as the tree of life. In Part 2 of this book, we will make use of the tree of life and many smaller-scale phylogenetic trees to understand our planet’s biological diversity.
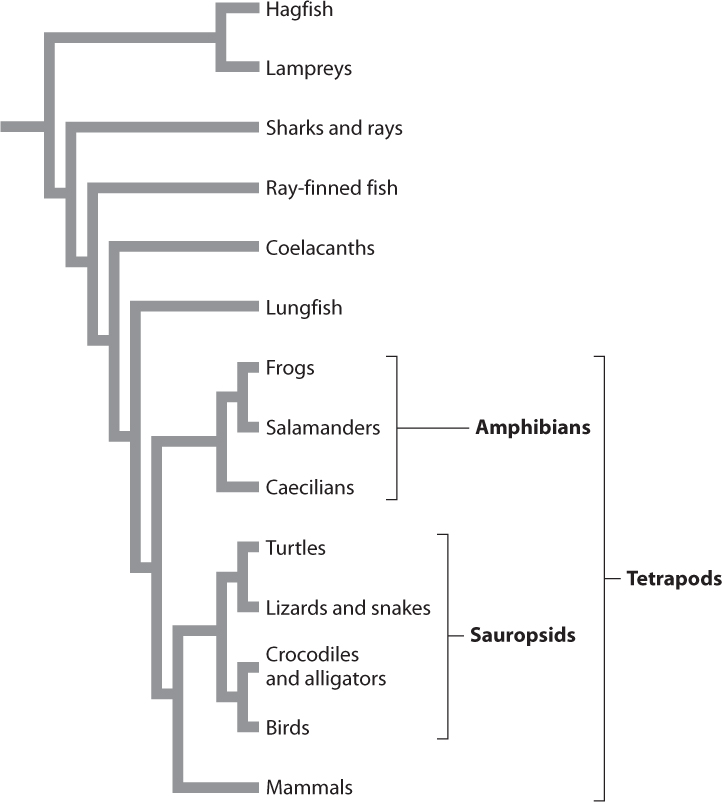
Fig. 23.2 shows a phylogenetic tree for vertebrate animals. The informal name at the end of each branch represents a group of organisms, many of them familiar. We will sometimes find it useful to refer to groups of species this way (for example, “frogs,” or the “Class Anura”) rather than name all the individual species or list the characteristics they have in common. It is important, however, to remember that such named groups represent a number of member species. If, for example, we were able to zoom in on the branch labeled “Frogs,” we would see that it consists of many smaller branches, each representing a distinct species of frog.
This tree provides information about evolutionary relationships among vertebrates. For example, it proposes that the closest living relatives of birds are crocodiles and alligators. The tree also proposes that the closest relatives of all tetrapod (four-legged) vertebrates are lungfish. Phylogenetic trees are built from careful analyses of the morphological and molecular attributes of the species or other groups under study.
23-3
23.1.2 The search for sister groups lies at the heart of phylogenetics.
Two species, or groups of species, are considered to be closest relatives if they share a common ancestor not shared by any other species or group. In Fig. 23.2, for example, we can see that frogs are more closely related to salamanders than to any other group of organisms because frogs and salamanders share a common ancestor not shared by any other group. Similarly, lungfish are more closely related to tetrapods than to any other group. A lungfish may look more like a fish than it does a frog or salamander, but lungfish are more closely related to frogs and salamanders than they are to other fish because lungfish share a common ancestor with frogs and salamanders that was more recent than their common ancestor with other fish (Fig. 23.2).
Groups that are more closely related to each other than either of them is to any other group, like lungfish and tetrapods, are called sister groups. Simply put, phylogenetic hypotheses amount to determining sister-group relationships because the simplest phylogenetic question we can ask is which two of any three species (or other groups) are more closely related to each other than either is to the third. In this light, we can see that a phylogenetic tree is simply a set of sister-group relationships in which each addition of a species beyond the original three entails finding its sister group in the tree.
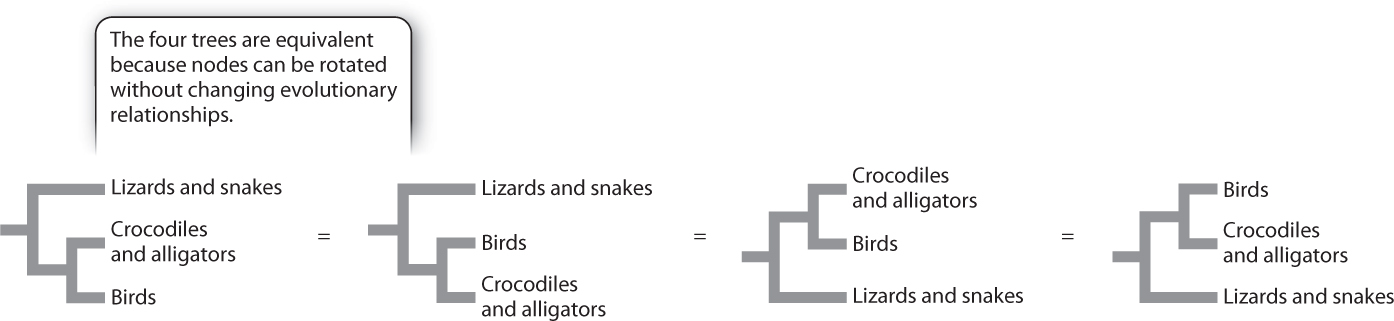
Closeness of relationship is then determined by looking to see how recently two groups share a common ancestor. Shared ancestry is indicated by a node, or branch point, on a phylogenetic tree. An important aspect of a node is that it can be rotated without changing the evolutionary relationships of the groups. Fig. 23.3, for example, shows four phylogenetic trees depicting evolutionary relationships among birds, crocodiles and alligators, and lizards and snakes. In all four trees, birds are a sister group to crocodiles and alligators because birds, crocodiles, and alligators share a common ancestor not shared by lizards and snakes. Information about evolutionary relationships therefore lies in the order of nodes over time, not the order of groups along the tips.
Question Quick Check 1

No. The two trees are equivalent. The node shared by humans and mice is simply rotated in one tree compared to the other tree. In both trees, the closest relative of humans is mice.
23-4
23.1.3 A monophyletic group consists of a common ancestor and all its descendants.
So far in our discussion, we have used the word “group” as a kind of summary word to mean all the species in some taxonomic entity under discussion. A more technical word is taxon (plural, taxa), with taxonomy providing a formal means of naming groups. In recent decades, biologists have worked to integrate evolutionary history with taxonomic classification. The resulting classification emphasizes groups that are monophyletic, meaning that all members share a single common ancestor not shared with any other species or group of species. In Fig. 23.2, the tetrapods are monophyletic because they all share a common ancestor not shared by any other taxa. Similarly, amphibians are monophyletic.
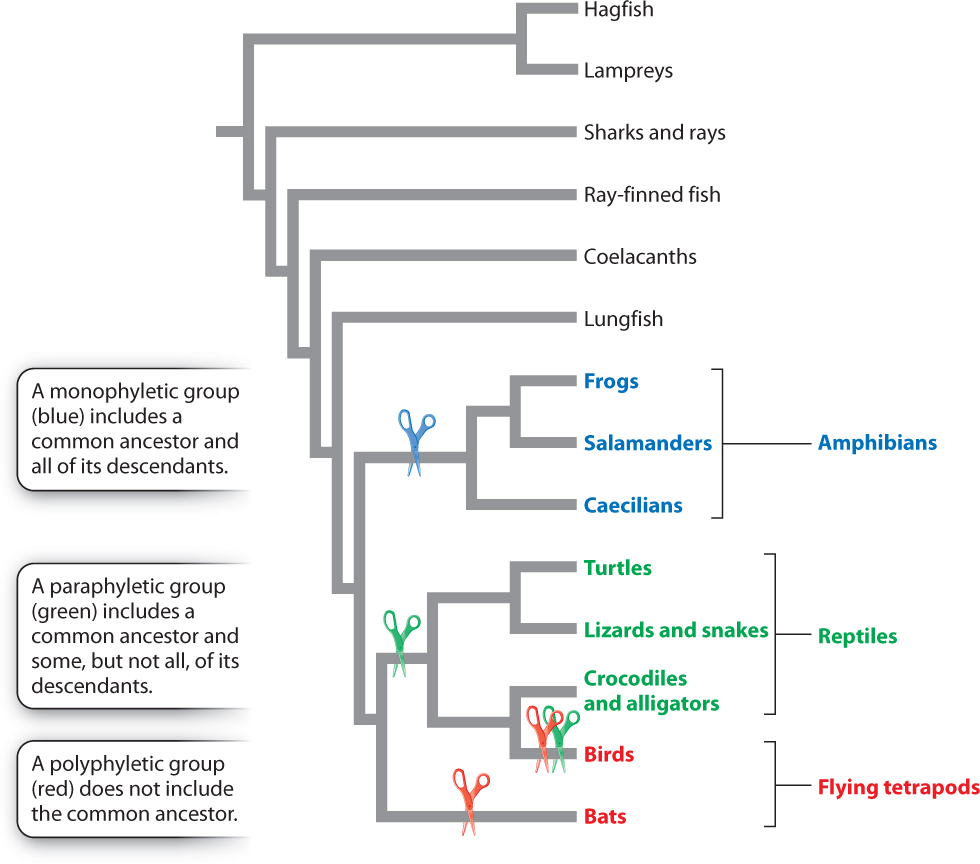
In contrast, consider the group of animals traditionally recognized as reptiles, which includes turtles, snakes, lizards, crocodiles, and alligators (see Fig. 23.2). The group “reptiles” excludes birds, although they share a common ancestor with the included animals. Such a group is considered paraphyletic. A paraphyletic group includes some, but not all, of the descendants of a common ancestor. Early zoologists separated birds from reptiles because they are so distinctive, but feathers and other unique features of birds do not tell us about their relationship to other vertebrates. In fact, many features of skeletal anatomy and DNA sequence strongly support the placement of birds as a sister group to the crocodiles and alligators.
There is a simple way to distinguish between monophyletic and paraphyletic groups, illustrated in Fig. 23.4. If in order to separate a group from the rest of the phylogenetic tree you need only to make one cut, the group is monophyletic. If you need at least two cuts to separate the group from the tree, it is paraphyletic.
Groupings that do not include the last common ancestor of all members are called polyphyletic. For example, clustering bats and birds together as flying tetrapods results in a polyphyletic group (Fig. 23.4).
Determining what sets of organisms are considered monophyletic groups is a main goal of phylogenetics because monophyletic groups include all descendants of a common ancestor and only the descendants of that common ancestor. This means that monophyletic groups alone show the evolutionary path a given group has taken since its origin. Omitting some members of a group, as in the case of reptiles and other paraphyletic groups, can provide a misleading sense of evolutionary history. By using monophyletic groups in taxonomic classification, we effectively convey our knowledge of their evolutionary history.
Question Quick Check 2
RuGt0kn4LlW/3MGscGh58jq4sMKkjZ83rfCmpmmsJj+F0YciA9rf4nVENHr6X1oGzRPLoSiXvLU=23.1.4 Taxonomic classifications are information storage and retrieval systems.
The nested pattern of similarities among species has been recognized by naturalists for centuries. As we saw in Chapter 22, closely related species group together on a single branch of the tree of life. In the vocabulary of formal classification, closely related species are grouped into a genus (plural, genera). Closely related genera, in turn, belong to a larger, more inclusive branch of the tree—they are classified as a family. Closely related families, in turn, form an order, orders form a class, classes form a phylum (plural, phyla), and phyla form a kingdom, each more inclusive taxonomic level occupying a successively larger limb on the tree (Fig. 23.5). Biologists today commonly refer to the three largest limbs of the entire tree of life as domains (the Eukarya, or eukaryotes; Bacteria; and Archaea, or archaeons, introduced in Chapter 1 and discussed more fully in Chapters 26 and 27).
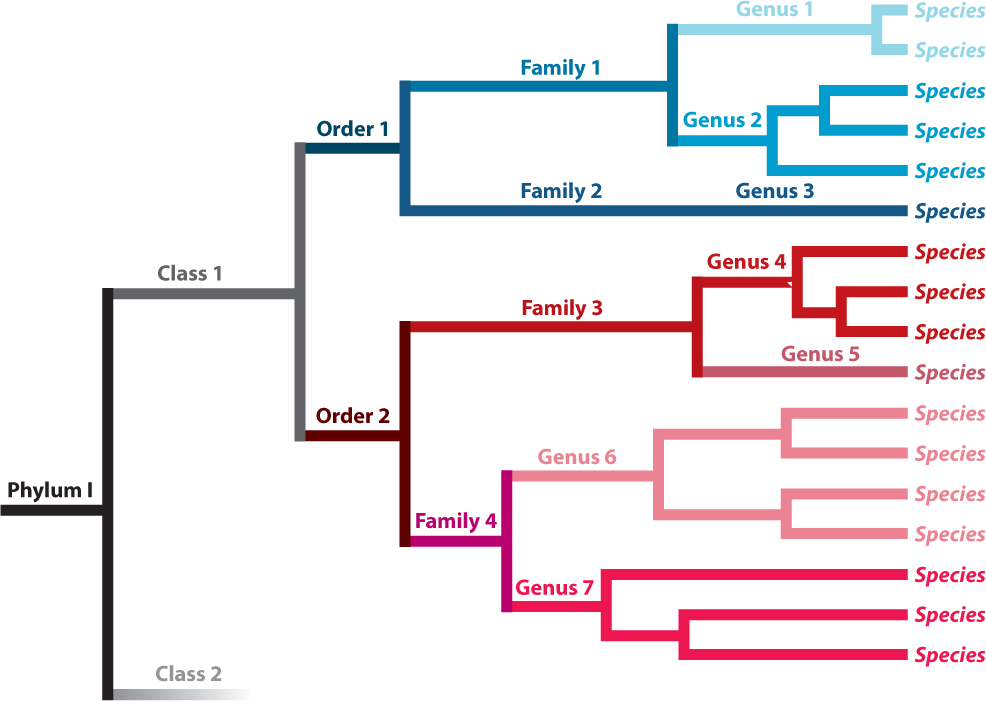
The ranks of classification form a nested hierarchy, but the boundaries of ranks above the species level are arbitrary in that there is nothing particular about a group that makes it, for example, a class rather than an order. For this reason, it is not necessarily true that orders or classes of, for example, birds and ferns are equivalent in any meaningful way. In contrast, sister groups are equivalent to one another in several ways—notably, in that they diverged from a single ancestor at a single point in time. Therefore, if one branch is a sister group that contains 500 species and the other has 6, the branches have experienced different rates of speciation, extinction, or both since they diverged. In Fig 23.5, Families 1 and 2 are sister groups but Family 1 has five species while Family 2 has just one.
23-5