23.2 BUILDING A PHYLOGENETIC TREE
Up to this point, we have focused on how to interpret a phylogenetic tree, a diagram that depicts the evolutionary history of organisms. But how do we infer their evolutionary history from a group of organisms? That is, how do we actually construct a phylogenetic tree? Biologists use characteristics of organisms to figure out their relationships. Similarities among organisms are particularly important in that similarities sometimes suggest shared ancestry. However, a key principle of constructing trees is that only some similarities are actually useful. Others can in fact be misleading.
23.2.1 Homology is similarity by common descent.
Phylogenetic trees are inferred by comparison of character states shared among different groups of organisms. Characters are the anatomical, physiological, or molecular features that make up organisms. To be useful for phylogenetic reconstruction, they must vary among but not within species and have a genetic basis. In general, characters have several observed conditions, called character states. In the simplest case, a character can be present or absent—lungs are present in tetrapods and lungfish, but absent in other vertebrate animals. Commonly, however, multiple character states are apparent—petals are a character of flowers, for example, and their arrangement can be considered a character state. Flowers can have many petals arranged in a helical pattern, many petals arranged in a whorl, few petals arranged in a whorl, or few petals fused into a tube. All species contain some character states that are shared with other members of their group, some that are shared with members of other groups, and some that are unique.
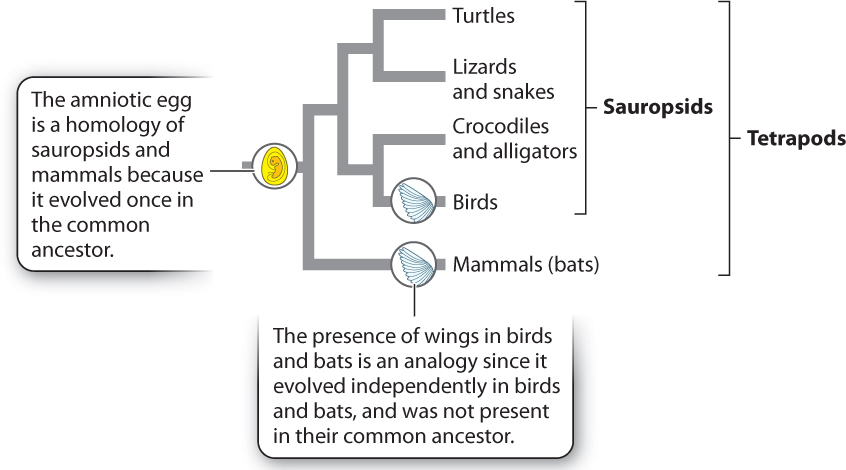
Character states can be similar for one of two reasons: The character state was present in the common ancestor of the two groups and retained over time (common ancestry), or the character state independently evolved in the two groups as an adaptation to similar environments (convergent evolution). Consider two examples. In the vertebrate phylogeny shown in Fig. 23.6, mammals and birds both produce amniotic eggs. Because amniotic eggs occur only in groups descended from the common ancestor at the node connecting the mammal and sauropsid branches of the tree, we reason that birds and mammals each inherited this character from a common ancestor in which the trait first evolved. Characters that are similar because of descent from a common ancestor are said to be homologous.
23-6
Not all similarities arise in this way, however. Think of wings, a character exhibited by both birds and bats (which are mammals). Much evidence supports the view that wings in these two groups do not reflect descent from a common, winged ancestor but rather evolved independently in the two groups. Similarities due to independent adaptation by different species are said to be analogous. They are the result of convergent evolution.
Innumerable convergences less dramatic than wings are known. In some, we even understand the genetic basis of the convergence. For example, echolocation has evolved in bats and in dolphins, which are also mammals. Prestin is a protein in the hair cells of ears that is involved in hearing ultrasonic frequencies. Both bats and dolphins have evolved parallel changes in the Prestin genes, apparently convergent adaptations for echolocation. Similarly, unrelated fish that live in freezing water at the poles, Arctic and Antarctic, have evolved similar glycoproteins that act as molecular “antifreeze,” preventing the formation of ice in their tissues.
Question Quick Check 3
d6rXLT+1z1dkHJVXIEUG4TkBKNPmXKOpCM5/IqqHCA2Gq3knqR93klKznVIPSdTf/tTlW0pJdXymiheUotH9IDbvnHmiD313163msuj6rrLfyv38v89Br9YW1ofpxuVJrFXTCq4dpE8hN8QWc3N1liZ/YcdyriFwh442xoB/Zv2Ln37g23.2.2 Shared derived characters enable biologists to reconstruct evolutionary history.
Because homologies result from shared ancestry, only they, and not analogies, are useful in constructing phylogenetic trees. However, it turns out that only some homologies are useful. For example, character states that are unique to a given species or other monophyletic group can’t tell us anything about its sister group. They evolved after the divergence of the group from its sister group and so can be used to characterize a group but not to relate it to other groups. Similarly, homologies formed in the common ancestor of the entire group and therefore present in all its descendants do not help to identify sister-group relationships among the groups under consideration.
What we need to develop hypotheses of evolutionary relationship are homologies shared by some, but not all, of the members of the group under consideration. These are shared derived characters and are called synapomorphies. A derived character state is an evolutionary innovation (for example, the change from five toes to a single toe—the hoof—in the ancestor of horses and donkeys). When such a novelty arises in the common ancestor of two taxa, it is shared by both (thus the hoof is a synapomorphy defining horses and donkeys as sister groups).
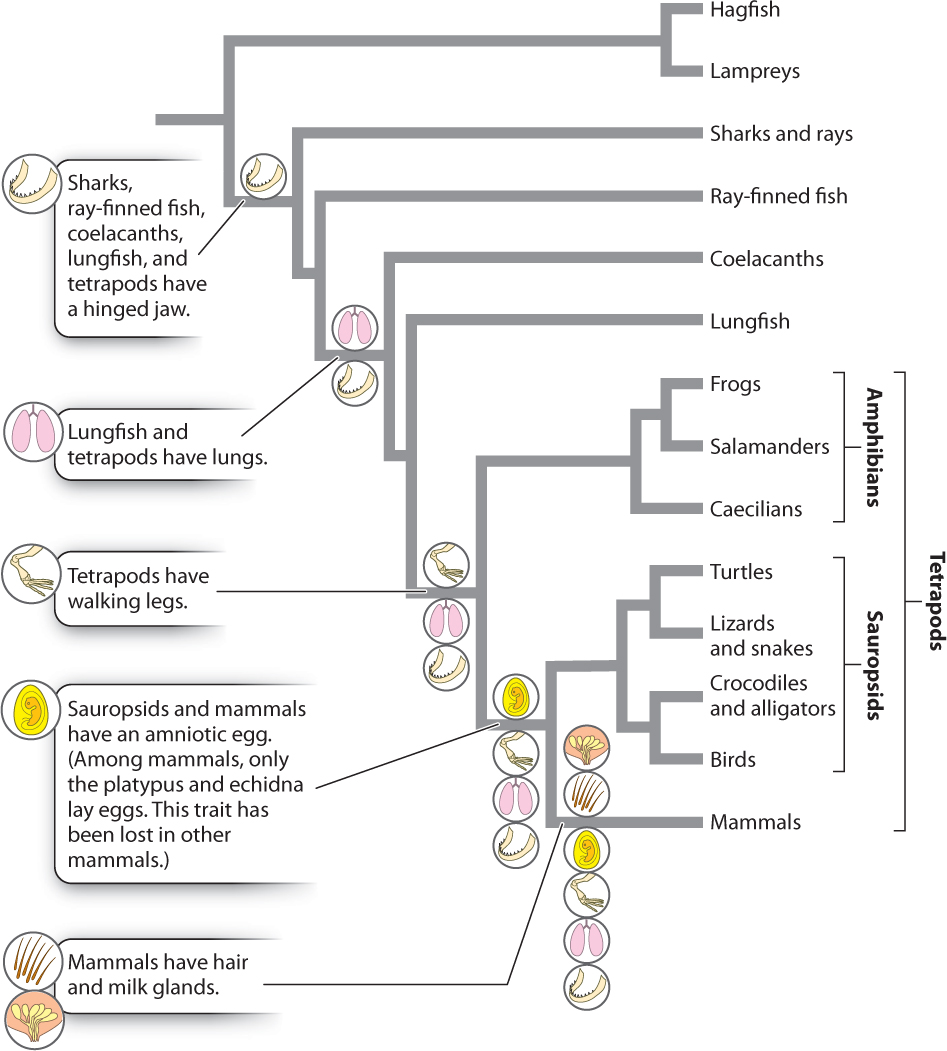
In Fig. 23.7, we indicate the major synapomorphies that have helped us construct the phylogeny of vertebrates. For example, the lung is a character present in lungfish and tetrapods, but absent in other vertebrates. Thus, the presence of lungs provides one piece of evidence that lungfish are the sister group of tetrapods. Phylogenetic reconstruction on the basis of synapomorphies is called cladistics.
23.2.3 The simplest tree is often favored among multiple possible trees.
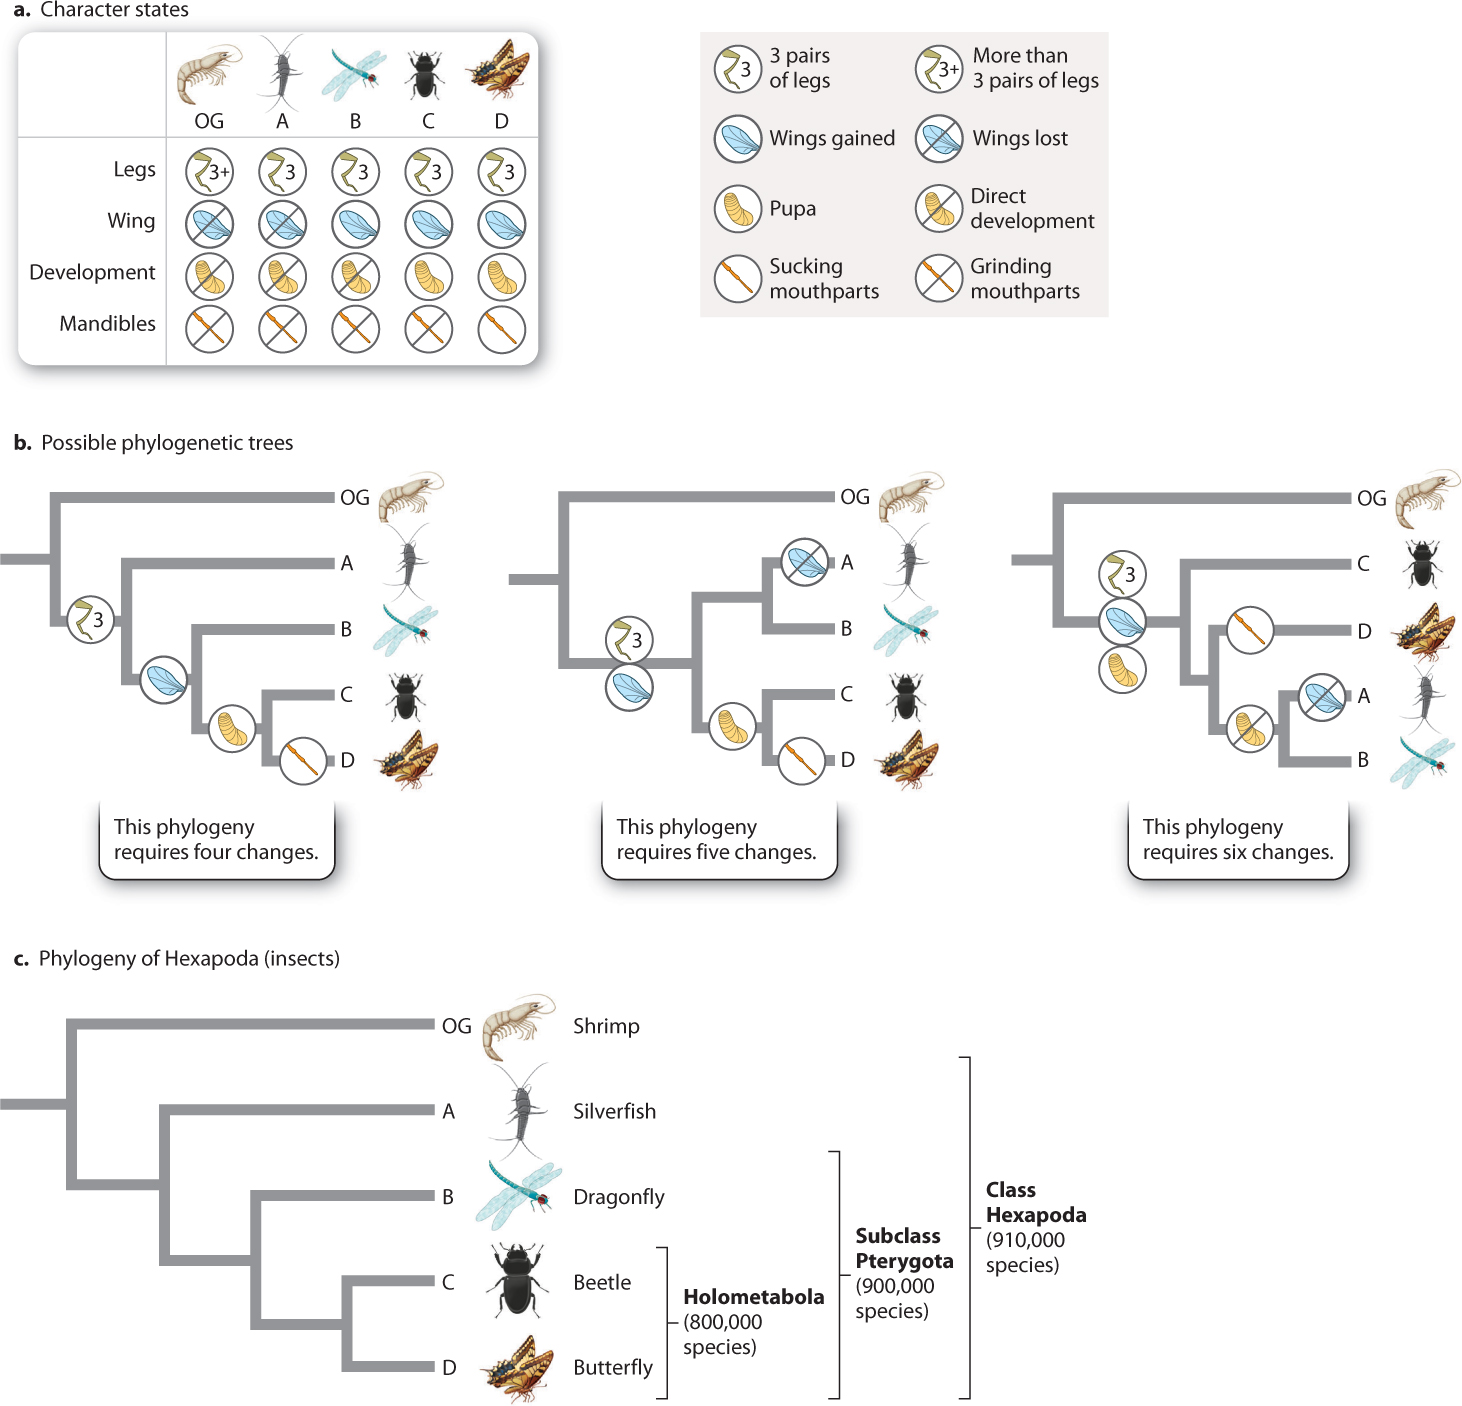
To show how synapomorphies help us chart out evolutionary relationships, let’s consider the simple example in Fig. 23.8. We begin with four species of animals in a group we wish to study, labeled “A” through “D,” that we will call our ingroup; we believe them to be closely related to each other. For comparison, we have a species that we believe is outside this ingroup—that is, it falls on an earlier branch of the tree—and so is called an outgroup (labeled “OG” in Fig. 23.8). Each species in the ingroup and outgroup has a different combination of characters, such as leg number, presence of wings, and whether development of young to adult is direct or goes through a pupal stage (Fig. 23.8a).
23-7
We are interested in the relationships among species A–D and so focus on potential synapomorphies—character states shared by some but not all species within the group. For example, only C and D have pupae. This character suggests that C and D are more closely related to each other than either is to the other species. The alternatives are that C and D each evolved pupae independently or that pupae were present in the common ancestor of A–D but were lost in A and B.
23-8
How do we choose among the alternatives? Comparison with the outgroup shows that it does not form pupae, supporting the hypothesis that pupal development evolved within the ingroup. In practice, biologists examine multiple characters and choose the phylogenetic hypothesis that best fits all of the data.
How do we determine “best fit”? The phylogenetic tree shown on the left in Fig. 23.8b considers four characters and their various character states and reflects the sister-group relationship between C and D proposed earlier. This tree requires exactly four character-state changes during the evolution of these species: reduction of leg pairs to three in the group ABCD, wings in the group BCD, and pupae in group CD, plus a change of form of the mandible, or jaw, in species D.
Now consider the middle tree in Fig. 23.8b. It groups A and B together, and so differs from the tree on the left in requiring either a loss of wings in A, or an additional origin of wings in B, independent of that in the ancestor of CD—five changes in all. The tree on the right groups A and B together, and requires two extra steps for a total of six steps. No tree that we can construct from species A–D requires fewer than four evolutionary changes, so the left-hand version in Fig. 23.8b is the best available hypothesis of evolutionary relatedness. In fact, this is the phylogeny for a sample of species from the largest group of animals on Earth, the Hexapoda—or insects (Fig. 23.8c).
In general, trees with fewer character changes are preferred to ones that require more because they provide the simplest explanation of the data. This approach is an example of parsimony, that is, choosing the simpler of two or more hypotheses to account for a given set of observations. In systematics, parsimony suggests counting character changes on a phylogenetic tree to find the simplest tree for the data (the one with the fewest number of changes). Each change corresponds to a mutation (or mutations) in an ancestral species, and the more changes or steps we propose, the more independent mutations we must also hypothesize.
Note also that it isn’t necessary to make decisions in advance about which characters are homologies and which are analogies. We can construct all possible trees and then choose the one requiring the fewest evolutionary changes. This is a simple matter for the example in Fig. 23.8, because four species can be arranged into only 15 possible different trees. As the number of groups increases, however, the number of possible trees connecting them increases as well, and dramatically so. There are 105 trees for 5 groups and 945 trees for 6 groups, and there are nearly 2 million possible trees for 10. For 50 groups the possibilities balloon to 3 × 1076! Clearly, computers are required to sort through all the possibilities.
As is true for all hypotheses, phylogenetic hypotheses can be strongly supported or weakly supported. Biologists use statistical methods to evaluate a given phylogenetic hypothesis. Available character data may not strongly favor any hypothesis. When support for a specific branching pattern is weak, biologists commonly depict the relationships as unresolved and show multiple groups diverging from one node, rather than just two, as we have seen. Such branching patterns are not meant to suggest that multiple species diverged simultaneously, but instead to indicate that we lack the data to choose unequivocally among several different hypotheses of relationships. In Part 2 of this book, we will encounter unresolved branches in a number of groups. These shouldn’t be read as admissions of defeat, but instead as problems awaiting resolution and opportunities for future research.
23.2.4 Molecular data complement comparative morphology in reconstructing phylogenetic history.
Trees can be built using anatomical features as characters, but increasingly, tree construction relies on molecular data. The amino acids at particular positions in the primary structure of a protein can be used as characters, as can the nucleotides at specific positions along a strand of DNA.
From genealogy to phylogeny, tracing mutations in DNA or RNA sequences has revolutionized the reconstruction of historical genetic connections. Whether we are tracing the paternity of the children of Sally Hemings, mistress of Thomas Jefferson, identifying the origin of a recent cholera epidemic in Haiti, or placing baleen whales near the Hippopotamus family in a phylogenetic tree of mammals, molecular data give insights through their highly detailed information.
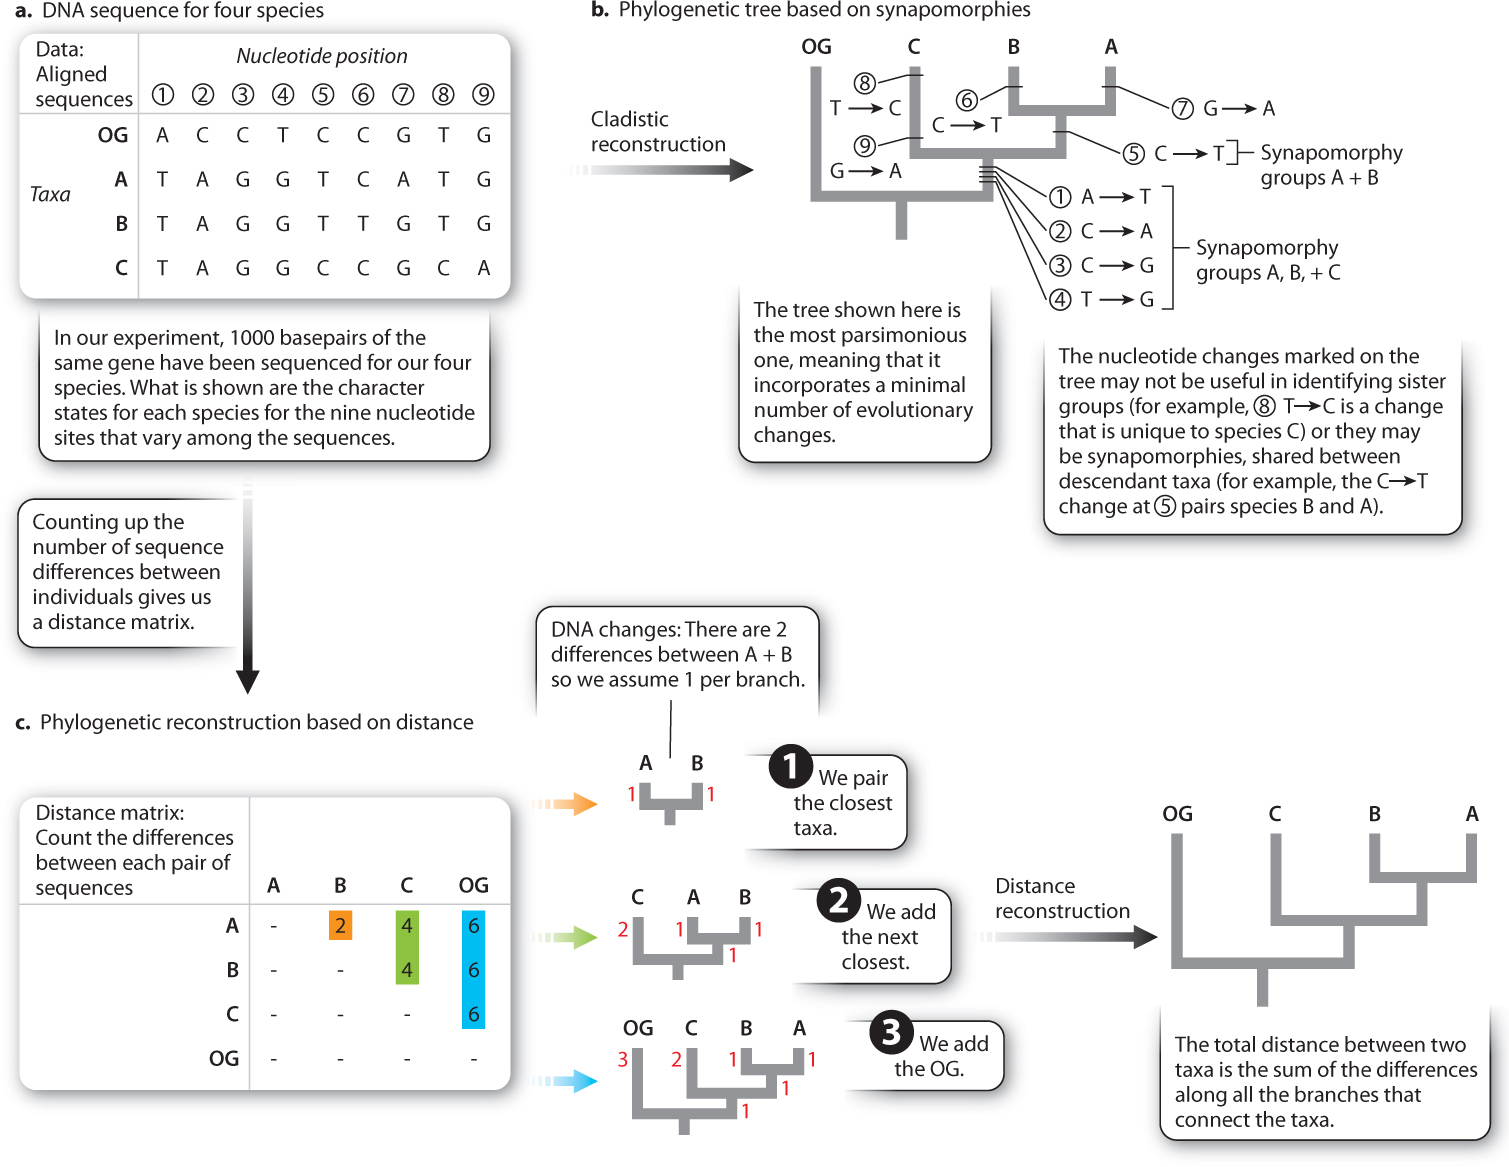
Much of what we know already about molecular evolution comes from phylogenetic comparisons previously established by comparative morphology, the study of structures and forms in different taxa. It is important to recognize that there is nothing about molecular data that provides a better record of history than does comparative morphology; molecular data simply provide more details. Indeed, for microbes and viruses, there is very little morphology available, so molecular information is critical for phylogenetic reconstruction in these microscopic taxa. Once a gene or other stretch of DNA or RNA with suitable levels of variation is identified in two or more species, sequences are obtained and aligned to identify homologous nucleotide sites. Analyses of this kind have typically involved comparisons of sequences of about 1000 nucleotides from one or more genes. Increasingly, though, the availability of whole-genome sequences is changing the way we do molecular phylogenetics: Rather than comparing the sequences of a few genes, we compare the sequences of entire genomes.
The process of using molecular data is conceptually similar to the process described earlier for morphological data. Through comparison to an outgroup, we can identify derived and ancestral molecular characters (whether DNA nucleotides or amino acids) and generate the phylogeny on the basis of synapomorphies as before.
23-9
An alternative method of reconstruction is based on distance rather than synapomorphies. Here the premise is simple: The descendants of a recent common ancestor will have had relatively little time to evolve differences, whereas the descendants of an ancient common ancestor have had a lot of time to evolve differences. Thus similarity (or low distance) indicates the recency of common ancestry.
Underpinning this approach is the assumption that the rate of evolution is constant (otherwise, a pair of taxa with a recent common ancestor could be more different than expected because of an unusually fast rate of evolution). This rate-constancy assumption is less likely to be violated when we are using molecular data than when we are using morphological data. Recall from Chapter 21 that the molecular clock is based on the observation of constant accumulation of genetic divergence through time. Fig. 23.9 shows a simple DNA sequence dataset which we can analyze either on the basis of synapomorphies (Fig. 23.9b) or on the basis of distance (Fig. 23.9c). Note that both give the same result in this case.
Molecular data are often combined with morphological data in analyses, and each can also serve as an independent assessment of the other. Not surprisingly, results from analyses of each kind of data are commonly compatible, at least for plants and animals rich in morphological characters.
Today, the single largest library of taxonomic information is the National Institutes of Health’s genetic data storage facility, called GenBank. As of this writing, GenBank gives users access to more than 100 billion observations (mostly nucleotides) collected under more than 400,000 taxonomic names. A growing web resource is Encyclopedia of Life, which is gathering additional biological information about species, including ecology, geographic distributions, photographs, and sounds in pages for individual species that are easy to navigate. Another web-based resource, the Tree of Life, provides information on phylogenetic trees for many groups of organisms.
23-10
23.2.5 Phylogenetic trees can help solve practical problems.
The sequence of changes on a tree from its base to its tips documents evolutionary changes that have accumulated through time. Trees suggest which lineages are older than others, and which traits came first and which followed later. Proper phylogenetic placement thus reveals a great deal about evolutionary history, and it can have practical consequences as well. For example, oomycetes, microorganisms responsible for potato blight and other important diseases of food crops, were long thought to be fungi because they look a lot like some fungal species. The discovery, using molecular characters, that oomycetes belong to a very different group of eukaryotic organisms, has opened up new possibilities for understanding and controlling these plant pathogens. Similarly, in 2006, researchers used DNA sequences to identify the Malaysian parent population of the lime swallowtails that had become an invasive species in the Dominican Republic.
Phylogenetics solved a famous case in which an HIV-positive dentist in Florida was accused of infecting his patients (Fig. 23.10). Nucleotide sequence in the genome of HIV evolves so rapidly that biologists can build phylogenetic trees that trace the spread of specific strains from one individual to the next. Phylogenetic study of HIV present in samples from several infected patients, the dentist, and other individuals provided evidence that the dentist had, indeed, infected his patients.
FIG. 23.10: Did an HIV-positive dentist spread the AIDS virus to his patients?
BACKGROUND In the late 1980s, several patients of a Florida dentist contracted AIDS. Molecular analysis showed that the doctor was HIV-positive.
HYPOTHESIS It was hypothesized that the patients acquired HIV during dental procedures carried out by the infected dentist.
METHOD Two HIV samples (denoted 1 and 2 in the figure) were obtained from several people, including the dentist (Dentist 1 and Dentist 2), several of his patients (Patients A through G), and other HIV-positive individuals chosen at random from the local population (LP). In addition, a strain of HIV from Africa (HIVELI) was included in the analysis.
RESULTS Biologists constructed a phylogeny based on the nucleotide sequence of a rapidly evolving gene in the genome of HIV. Because the gene evolves so quickly, its mutations preserve a record of evolutionary relatedness on a very fine scale. HIV in some of the infected patients — patients A, B, C, E, and G — were more similar to the dentist’s HIV than they were to samples from other infected individuals. Some patients’ sequences, however, did not cluster with the dentist’s, suggesting that these patients, D and F, had acquired their HIV infections from other sources.
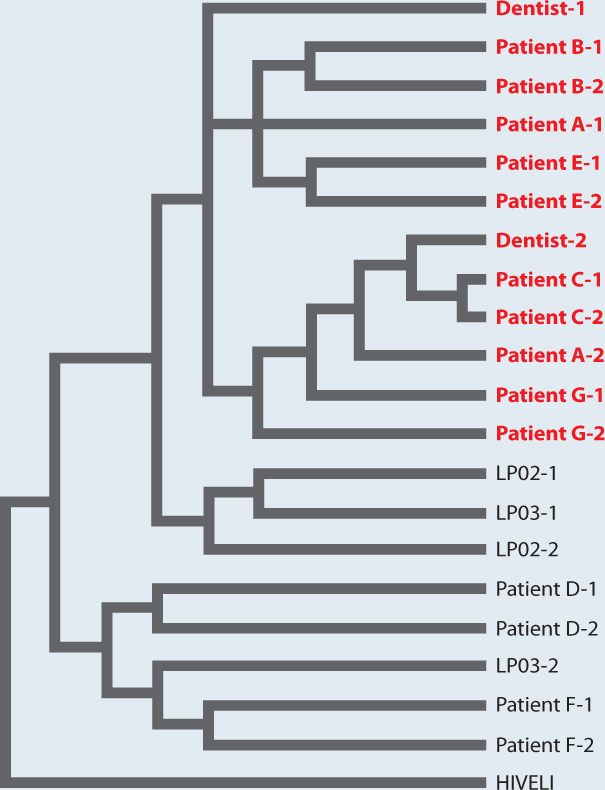
CONCLUSION HIV phylogeny makes it highly likely that the dentist infected several of his patients. The details of how the patients were infected remain unknown, but rigidly observed safety practices make it unlikely that such a tragedy could occur again.
FOLLOW-UP WORK Phylogenies based on molecular sequence characters are now routinely used to study the origin and spread of infectious diseases, such as swine flu.
SOURCE Hillis, D. M., J. P. Huelsenbeck, and C. W. Cunningham. 1994. “Application and Accuracy of Molecular Phylogenies.” Science 264:671–677.
23-11
Similarly, phylogenetic studies of influenza virus strains show their origins and subsequent movements among geographic regions and individual patients. Today, there is a growing effort to use particular DNA sequences as a kind of fingerprint or barcode for tracking biological material. Such information could quickly identify samples of shipments as meat from endangered species, or track newly emerging pests. The Consortium for the Barcode of Life has already accumulated on its website species-specific DNA barcodes for more than 100,000 species. Phylogenetic evidence provides a powerful tool for evolutionary analysis and is useful across timescales ranging from months to the entire history of life, from the rise of epidemics to the origins of metabolic diversity. Few other breakthroughs in science have had as broad an impact as that of phylogenetic systematics and the new sources of molecular data that have carried it so far.