46.2 AGE-STRUCTURED POPULATION GROWTH
Direct counting and mark-and-recapture methods permit ecologists to assess the size and density of populations in a particular place. However, not all organisms in a population contribute equally to population growth because some reproduce more than others. Therefore, it is also useful to take into account individuals that have differing reproductive capacities, which most often depend on differences in age. Biologists interested in the potential for population growth seek information on the age structure of a population, the number of individuals within each age group of the population studied. A population in which most individuals are past their age of greatest reproduction (because for some reason young are not surviving) or a population mostly composed of individuals younger than this age (because older individuals are not surviving) will not increase as rapidly as one dominated by individuals capable of greatest reproductive output.
46.2.1 Birth and death rates vary with age and environment.
To understand past and predict future changes in populations, ecologists use birth rates, expected longevity of individuals, and the proportion of individuals in a population that is able to reproduce. Insights into these parameters come from the age structure of the population.
Commonly, researchers divide the population, or a sample of the population, into age classes, for example individuals born within a single year or within an interval of several years. Age can often be determined by measuring an aspect of the organism’s anatomy (for example, counting growth rings in fish scales or a core drilled into a tree trunk) or estimated by overall size (for example, length of a fish, or tree height).
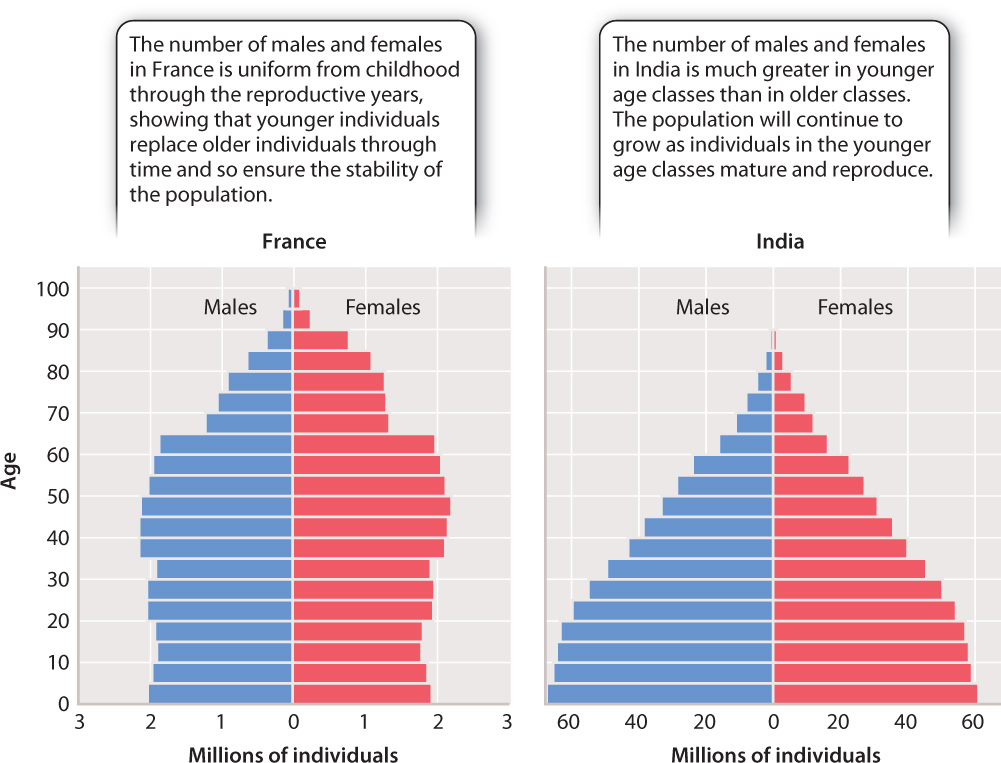
Estimating the number of individuals of differing ages enables ecologists to predict whether the size of a population will increase or decrease. This method applies to human populations as well as those of other species. A growing population usually shows a pyramid-shaped age distribution, with the youngest classes much more abundant than older classes, whereas a stable population shows a more even distribution of age classes. Fig. 46.8 shows the difference in age structure between France, a country with a stable population, and India, a country with a growing population.
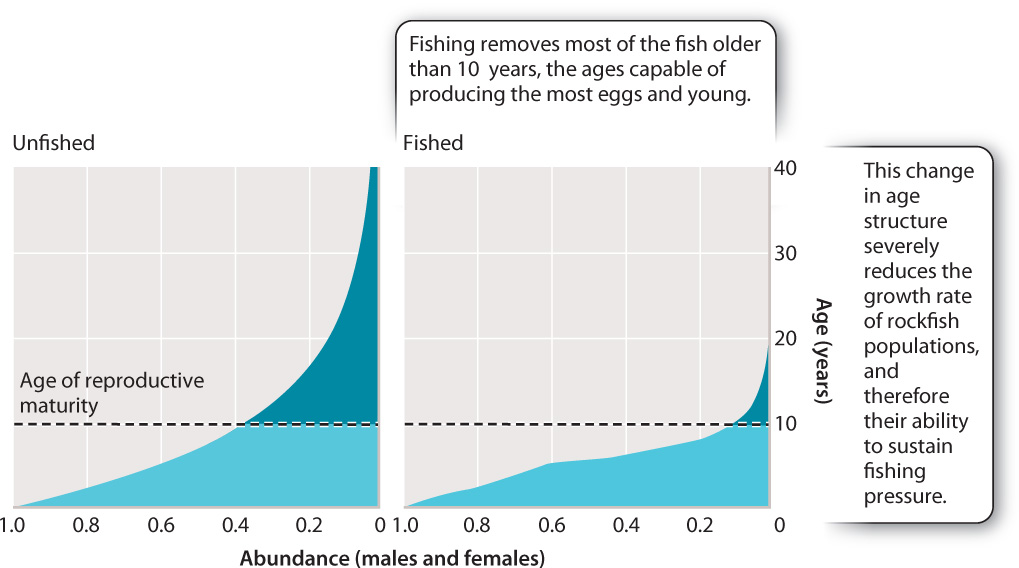
In humans, such differences reflect, in part, socioeconomic variation among countries, but differences in the age structure of other species can reveal threats from various sources. For example, the age structure of fish populations can be affected by the preferential capture of the largest fish, a recurring problem in commercial fisheries. Because the larger fish produce most of the eggs each year, this pattern can eventually lead to a rapid decrease in the population.
Fig. 46.9 shows the effects of overfishing on the age structure of a species of long-lived Pacific rockfish, determined by comparing the ages of fish sampled in unfished waters (Fig. 46.9a) with those in heavily fished waters (Fig. 46.9b). In the unfished population, the curve shows many individuals close to and past the age of 10 years, when reproductive ability starts to climb. In the fished populations, the curve shows a sharp decline of individuals older than 6 years because mostly older and larger fish are caught. Because these older fish produce most of the eggs and young fish, the annual reproductive effort of fished populations is severely affected by their removal.
46-9
46.2.2 Survivorship curves record changes in survival probability over an organism’s life-span.
The age structure of a population reflects death rates as well as births. Demography is the study of the size, structure, and distribution of populations over time and includes changes in response to birth, aging, migration, and death. The demography of the invasive Lime Swallowtail butterfly has been studied in Southeast Asia, where it is native, and this investigation may be helpful in predicting the population dynamics of this species in coming years as it spreads from Hispaniola across the Americas. Like many other insects, Lime Swallowtails have a pupal stage in which they metamorphose from a caterpillar larva specialized for feeding on leaves into a winged adult that can search for other plants on which to lay eggs (Chapter 44). Neither the larvae nor the pupae reproduce, but the adults that emerge from the pupae do.
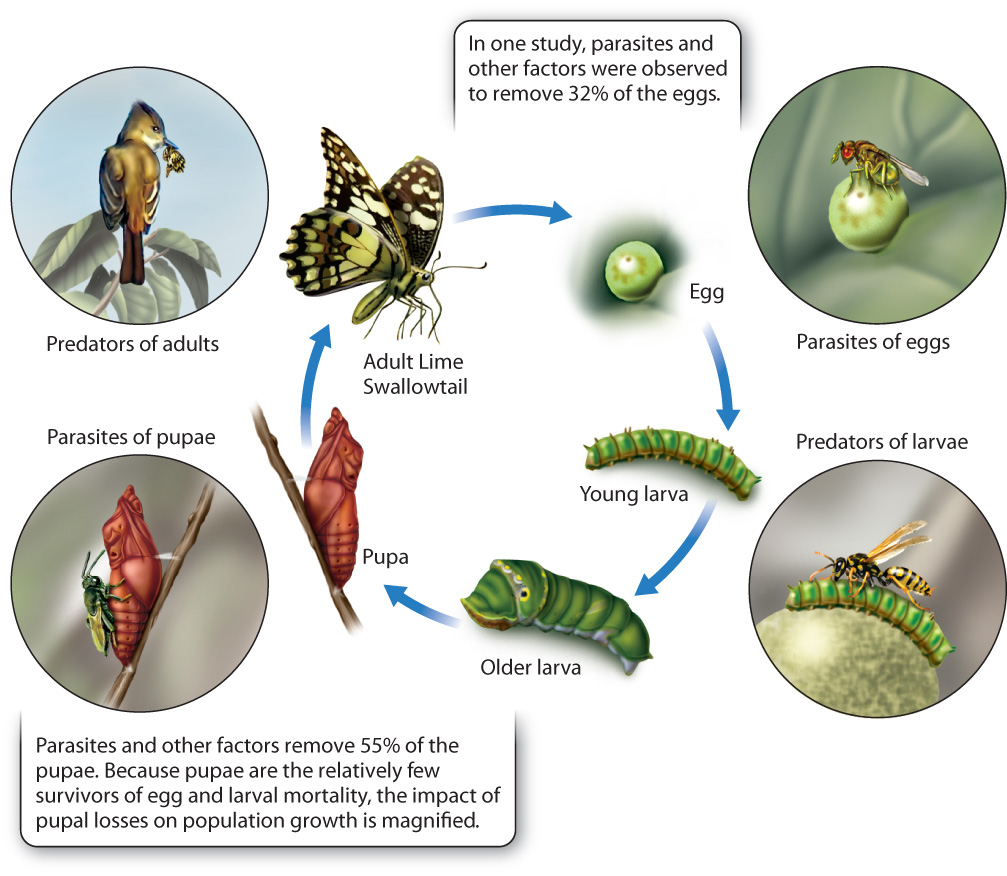
The factors that cause insect mortality commonly differ from one life stage to the next, and knowing their effects can help us understand the physical and biological influences on population growth. Fig. 46.10 shows the different dangers to each stage of the Lime Swallowtail’s life. These butterflies lay 30 or more eggs, but only a fraction of their eggs survive because of parasitism, drying out, falling from leaves, or predation by ants or other insects. The larvae have many defenses against predators, among them camouflage and chemical toxins, but they still fall prey to wasps, as well as to lizards and other animals, so the faster they develop into adults, the more likely they are to escape discovery by their enemies. The pupae, which are large and immobile, are perhaps the most vulnerable stage in the Lime Swallowtail life cycle, and they are often highly parasitized by a particular kind of wasp.
46-10
Fig. 46.11 presents data on the duration of each stage in the Lime Swallowtail life cycle and the numbers killed in that stage. We can consider the individual eggs that begin our study to form a cohort, a group defined as the individuals born at a given time, and we can trace their survival as they age. The proportion of individuals from the initial cohort that survive to each successive stage of the life cycle is called survivorship. When survivorship curves are plotted through time, they show an ever-declining fraction of the starting number of eggs (Fig. 46.11).
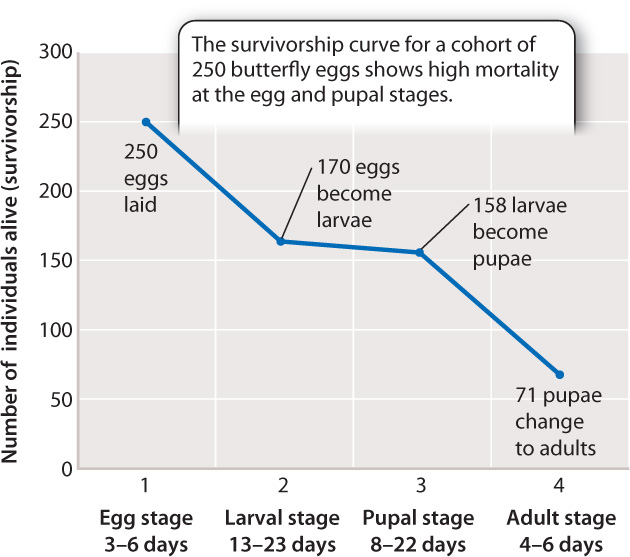
As expected from the preceding discussion, in this example, survival is lowest among eggs (68% survive to the next stage) and pupae (only 45% survive to the next stage), which of course cannot move to escape harm. If we divide the number lost at each stage by the number of days at that stage, we see that the egg stage loses 16 per day, the pupal stage loses 6 per day, but the larval stage loses only 0.6 per day. There is therefore strong selective pressure to decrease the length of each stage, especially those stages most vulnerable to mortality. Nevertheless, if we remember that each adult female can lay 30 or more eggs, only a very few eggs need to survive to the adult egg-laying stage to ensure the growth of the population. In warm climates like the Caribbean, these butterflies may reproduce eight or nine times in a year. Most of their eggs will not survive to become adults; if they did, available resources would soon be depleted.
46.2.3 Patterns of survivorship vary among organisms.
Populations differ in the ages at which they experience the most mortality. In some species, many offspring are produced, but high mortality early in life means that few survive to reproductive age. In other species, mortality is highest in older individuals, while in still other species, mortality occurs with equal frequency at all ages. Fig. 46.12 illustrates the three principal types of survivorship curve—Type I, Type II, and Type III— which correspond to the pattern of mortality: whether most mortality occurs late in life, is even throughout life, or is concentrated early in life, respectively.
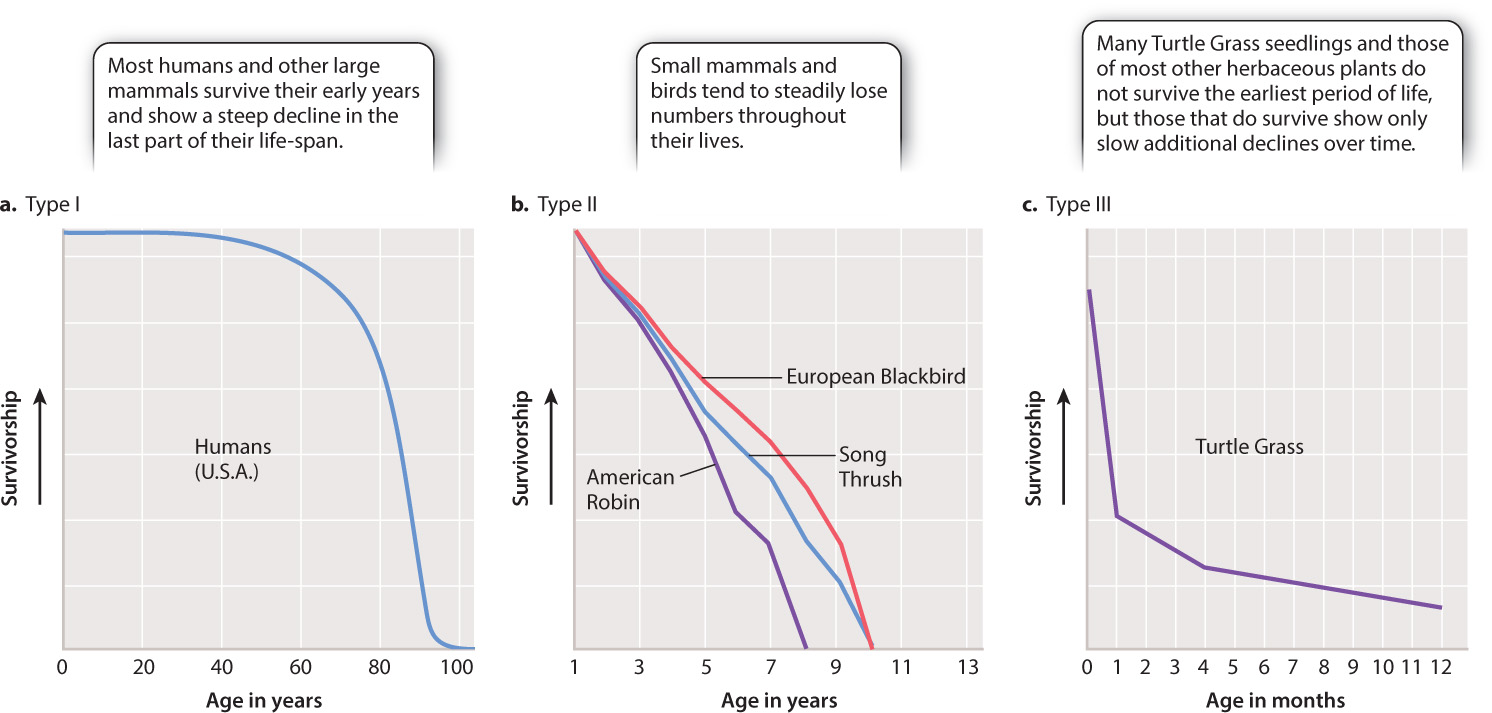
Human populations in affluent countries, which experience most mortality late in life, typically show a Type I survivorship curve (Fig. 46.12a). Other large animals, such as elephants and whales, show similar survivorship curves. Birds and many small mammals, on the other hand, commonly experience consistent levels of mortality throughout life, which can be graphed as a declining straight line. These animals, for which the probability of death does not change much through the life cycle, exhibit a Type II survivorship curve (Fig. 46.12b). Finally, organisms like Turtle Grass reflect high mortality at the earliest stages of their life cycles, resulting in a sharply declining survivorship curve that levels off (Fig. 46.12c). This pattern is characteristic of a Type III survivorship curve, which is typical of small herbaceous plants, small animals such as mice, insects like the Lime Swallowtail, and other organisms that grow fast and reproduce early.
46.2.4 Reproductive patterns reflect the predictability of a species’ environment.
In the preceding sections, we discussed population size and growth curves, and we outlined age structure and survivorship. These topics converge when we consider patterns of reproduction. Some species produce large numbers of offspring but provide few resources for their support. In Chapter 42, such species were described as r-strategists. In contrast, some species produce relatively few young but invest considerable resources into their support. These are termed K-strategists. How do these concepts relate to r and K in population growth?
In general, species that live in unpredictable environments produce many young. For example, when the environment is full of predators watching for vulnerable prey, such as gulls that watch for young turtles on a beach, or when resources are patchily distributed and abundant for only a short time, the chances of a young organism surviving to adulthood are low. Laying an egg, then, is like buying a lottery ticket—there is a limited chance of success. It is more advantageous to buy many tickets cheaply (that is, to have many offspring and make little parental investment in any of them) than to pay a lot for one. Thus, salmon and other fish produce many thousands of young, each with an extremely small chance of survival. As we saw earlier, Type III strategists like insects and plants also experience high mortality in the first stages of life. Because their reproductive success depends on the small chance that a few of their young will survive all the hazards they encounter, parents produce many offspring and invest relatively little in any of them. We refer to species like most fish as r-strategists because they reproduce at rates approaching r, the intrinsic rate of growth.
46-11
In contrast, species living where resources are predictable often produce a lower number of offspring and invest their reproductive resources in just a few, often larger and better-cared-for, offspring. These offspring are therefore better protected from predators, able to compete with others when they are young, and more likely to survive periods of bad weather. Large animals, such as eagles and bears, produce only two or three young, each of which is much more likely to survive to reproductive age than the offspring of small animals like mice, which have many predators and are easily killed by cold weather. Animals like eagles and bear are called K-strategists because their population densities commonly lie near the carrying capacity K, when resources become scarce.
These two strategies reflect an evolutionary trade-off.A reproductive individual has access to a finite amount of resources and can invest either in many inexpensive young or few well-provisioned offspring. Depending on the combination of physiology and environment, natural selection in a given set of circumstances tends to favor one strategy over the other. In fact, r- and K-strategists represent the opposite ends of a continuum in reproductive pattern. Many species lie between these extremes.
46.2.5 The life history of an organism shows trade-offs among physiological functions.
We’ve noted that population growth can be limited by resource availability. How an organism makes use of the resources that are available can also affect population growth. Each individual must devote some of its available food and energy intake to growth, some to the maintenance of cells and tissues, and some to reproduction. This allocation is very much like a household budget, in which incoming resources are divided among the day-to-day expenses of acquiring food and paying for housing and transportation, meeting present and future medical and educational expenses, and savings held in reserve for emergencies. When one category goes up in cost—it needs more money, or more resources—another must come down. In nature, individual organisms strike a balance in how they allocate resources to the basic needs of growth, maintenance, and reproduction, a balance that has evolved to minimize waste while retaining the flexibility to use resources in different ways depending on environmental circumstances. These kinds of trade-offs evolve through natural selection and are the rule in ecology, explaining in part why species tend to produce either many small offspring or a few larger ones.
The typical pattern of resource investment in each stage of a given species’ lifetime is called its life history. The amount of energy available for reproduction varies over an individual’s lifetime, and the degree of control an individual has over resource allocation also varies from species to species. Lizards, for example, show considerable flexibility in allocating resources to reproduction. Many lizards show a physiological trade-off from year to year between the number of eggs produced and the average size of each egg. There is a finite amount of resources to put into offspring, and lizards adjust the number and size of eggs depending on conditions in the environment. Larger eggs require more resources to build, leaving less for additional eggs, and larger eggs hatch into larger offspring that are better able to fend for themselves. But if the environment carries a high predation risk, for example, then laying more eggs scattered in different places may be a better strategy than laying a few larger eggs in one place. Does this flexibility make these lizards K-strategists or r-strategists? The answer is neither. Which strategy is optimal depends on the nature of the risks faced by young.
46-12
Plants also show physiological trade-offs in the allocation of resources to seeds. For example, flowers may abort some of their developing seeds to favor the growth of others. Plants also make trade-offs between defense and reproduction. When herbivores are around, plants that invest resources in defenses like poisons or thorns have an advantage over plants that do not invest in defenses. These defensive plants make a greater contribution to the next generation than nondefensive plants. However, when herbivores are absent, defensive plants are commonly at a competitive disadvantage. Individuals that do not invest in defenses can allocate more resources to reproduction. Such trade-offs in plant defense are especially important on nutrient-poor soils, where the cost of replacing valuable tissues lost to herbivores is higher than in nutrient-rich soils (Chapter 32).
The key point is that the various ways in which animals and plants allocate resources to growth and reproduction is rooted in their physiology, and their physiological traits are, themselves, evolved traits. Thus, as stated at the beginning of this chapter, ecology both reflects and determines how organisms function in nature.