48.2 HUMAN INFLUENCE ON THE CARBON CYCLE
In Chapter 25, we discussed the carbon cycle, explaining how photosynthesis removes carbon dioxide from the atmosphere and respiration replaces it. The remarkable data plotted in the Keeling curve (see Fig. 25.1) show that atmospheric CO2 levels have increased annually over the past 60 years, and analyses of air bubbles trapped in glacial ice show that this pattern of persistent increase began earlier, with the onset of the Industrial Revolution in the nineteenth century (see Fig. 25.3).
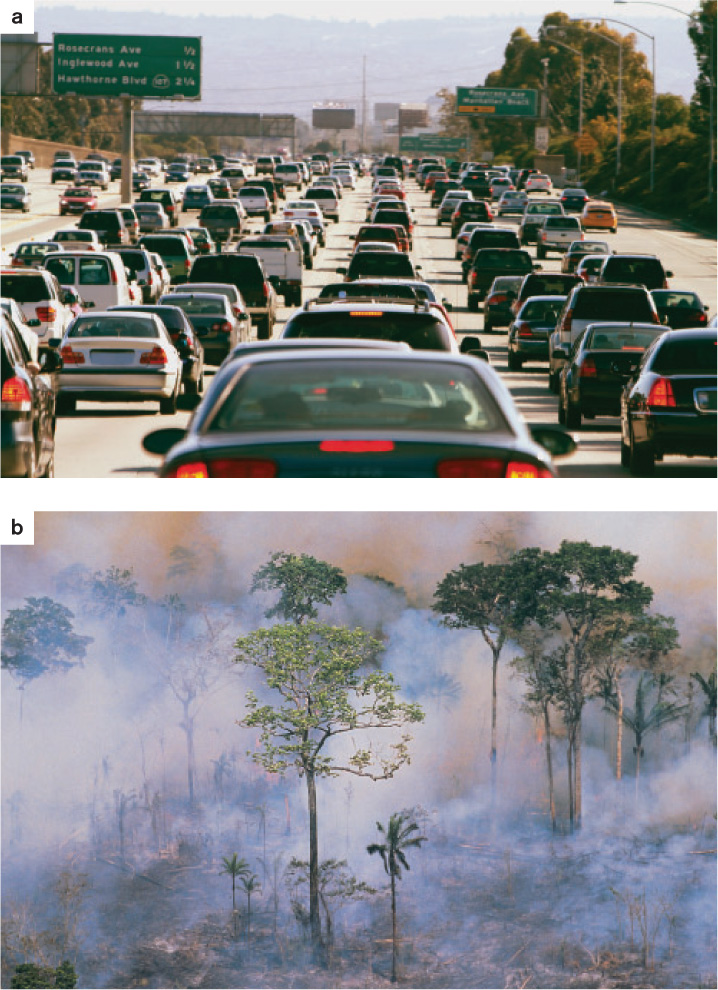
There is no longer any doubt that humans have become major contributors to the carbon cycle, particularly the part of the cycle in which ancient organic matter, or fossil fuel, is oxidized to CO2, returning CO2 to the atmosphere (Fig. 48.4). As discussed in Chapter 25, burning fossil fuel adds CO2 to the atmosphere at rates about 100 times greater than all Earth’s volcanoes together. As we saw in Chapter 25, measurements over the past several decades of the relative abundances of 12C, 13C, and 14C in atmospheric CO2 make it clear that the CO2 now being added to our air comes primarily from the combustion of fossil fuels. No other source of CO2 has the right isotopic composition to explain the measurements (see Fig. 25.4). Clearing forests for agriculture generates still more carbon dioxide (Fig. 48.4). When land is cleared for agriculture, the existing vegetation is generally burned off, converting much of the organic carbon in biomass and soil organic matter to CO2. No counteracting process removes CO2 at comparable rates.
48.2.1 As atmospheric carbon dioxide levels have increased, so has mean surface temperature.
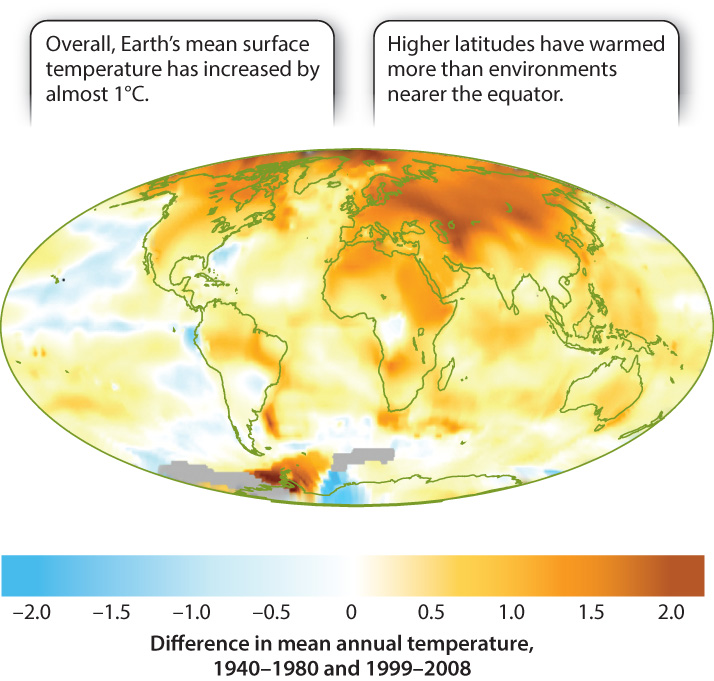
For the past century, scientists, sailors, and interested citizens have monitored temperature at weather stations around the world. More recently, satellites have enabled us to measure temperature in places as remote as the high Arctic and the middle of the ocean. The results are clear: In most parts of the world, mean annual temperature during the decade 1999–2008 was warmer than 1940–1980 averages (Fig. 48.5). In some places, the temperature change has been slight, but in others, especially at high latitudes, the increase has been as much as 2°C.
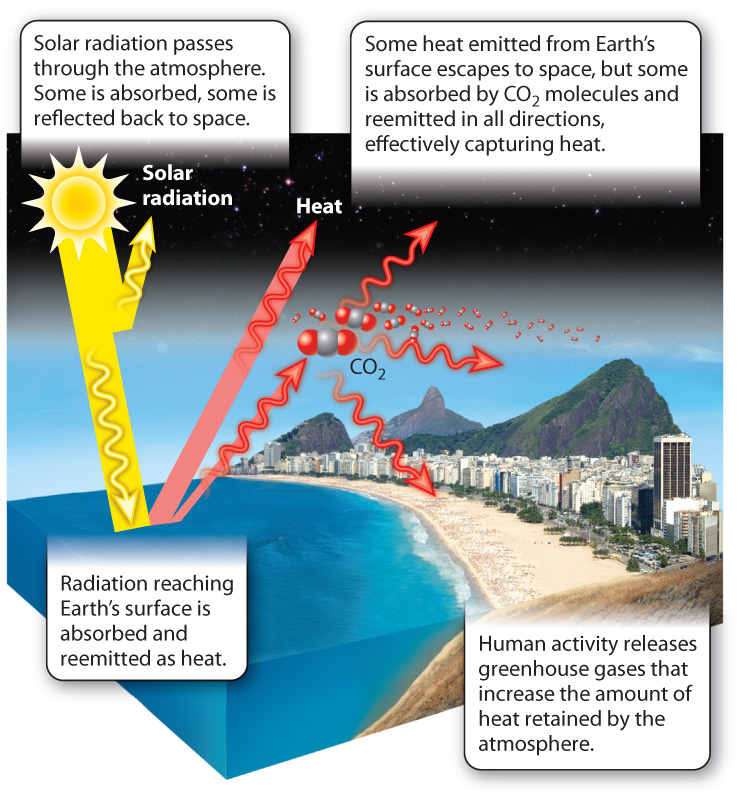
We can measure CO2 levels in the atmosphere, and they are increasing. We can measure global temperature, and it is increasing. Is increasing CO2 responsible for observed temperature changes? To address this question, we must understand that carbon dioxide is a greenhouse gas—that is, a gas that absorbs heat energy and then emits it in all directions. Why is that important? As shown in Fig. 48.6, solar radiation passes freely through the atmosphere, from top to bottom. Some incoming radiation is reflected from Earth’s surface, and the rest is absorbed by the land and sea. And some of the energy absorbed by Earth’s surface is radiated back again as infrared radiation, or heat. Greenhouse gases in the atmosphere absorb the infrared radiation reflected up from Earth’s surface and emit it in all directions—some will be directed upward, out of the atmosphere, but half will be directed downward, back toward Earth, effectively trapping heat. The net effect is like that of the glass panes of a greenhouse, which allow sunlight into the structure but prevent heat from leaving.
Carbon dioxide is only one of several important greenhouse gases in the atmosphere—water vapor is another, and methane a third—and without these gases absorbing and trapping heat, average surface temperatures would fall below freezing and life would not be possible. However, because CO2 is increasing rapidly, its greenhouse effect is also increasing. Methane levels are also rising rapidly, in large part because of increasing food production. Most of the methane delivered each year to the atmosphere is generated biologically by methane-producing archaeons (Chapter 26), which thrive in the guts of cattle and in the waterlogged paddies where rice is cultivated. More beef and expanded rice paddies translate into higher rates of methane production. The thawing of permafrost at high latitudes releases additional methane that was trapped in frozen soils when the ice formed long ago.
How much atmospheric warming is due to increases in greenhouse gases is a question of physics. Each molecule of greenhouse gas absorbs and emits a specific amount of heat, and calculations show that the increases in atmospheric greenhouse gases measured over the past 50 years have increased the difference between incoming (solar) and outgoing radiation by about 2.5 watts per square meter. This difference is what adds heat to the oceans and atmosphere. Scientific consensus, reflected in reports from the Intergovernmental Panel on Climate Change, is that this greenhouse effect is the principal cause of observed twentieth-century temperature change. Scientific consensus also holds that global temperature will continue to rise as atmospheric CO2 continues to increase in this century.
If this view is correct, human activities are changing the world. Can we, however, eliminate the possibility that the observed increases in greenhouse gases and temperature have natural causes? After all, as we saw in Chapter 25, the long-term geologic record indicates that climate and atmospheric composition have changed dramatically and repeatedly throughout our planet’s history. Perhaps volcanic emissions have increased, driving the observed changes. Measurements of the isotopic composition of atmospheric CO2 effectively eliminate volcanic eruptions as a principal source of rising CO2 (see Fig. 25.4).
Moreover, we can monitor the effects of volcanoes as they occur, and we can gauge the effects of past eruptions because volcanic ash accumulates along with the ice in continental glaciers. Historically, the major effect of large volcanic eruptions has been to decrease temperature, because volcanic ash and aerosols reflect incoming solar radiation back into space. What’s more, the impact of volcanic eruptions lasts only a few years. It doesn’t drive the century-long temperature increase that we are currently observing.
What about another possibility: that the amount of solar radiation entering the atmosphere has varied through time? The sun’s output oscillates, and we know from direct measurements how solar radiation has varied during the past 50 years. The effect of this variation can be calculated, and it turns out to be small relative to greenhouse effects. It does not seem that variable solar radiation can account for the amount of temperature change that we have observed.
Up to this point, then, there is overwhelming agreement among scientists that atmospheric CO2 levels are rising, that temperature is increasing, and that the physics of greenhouse gases relates the two effects. Beyond these facts, however, it is difficult to say with certainty how human-induced global trends in climate will affect a given area.
Why don’t we know for certain? Modeling future climatic conditions is difficult because of the many complex interactions that contribute to climate. Climate models are attempts to understand how climate works by fashioning equations that relate a simplified set of variables and interactions. Using mathematical models that accurately approximate current climate, modelers can change inputs into the model, adding CO2 to the atmosphere, for example, or changing the extent of forest cover. The model then generates a set of results that can be used to predict future climate. All models must be checked against actual observations, and most are sensitive to assumptions made in constructing the model. That said, climate models do a pretty good job of explaining global-scale features of climate and climatic change.
Nevertheless, questions remain. How, in detail, might cloud cover change over the next century, and what effect would this change have on temperature and precipitation? What will be the effect of additional air pollutants, like the black carbon particles released into the air when wood burns incompletely? Will black carbon increase warming by absorbing solar radiation, or decrease it by reflecting radiation back into space? How will oceanic and atmospheric circulation patterns change, and will any changes that may occur enhance or dampen climatic change?
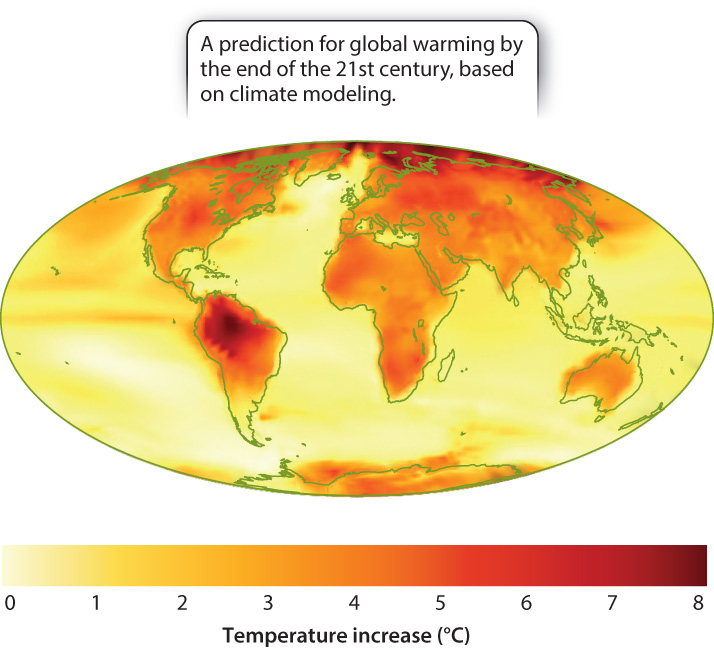
We still seek definitive answers for all these questions. Nonetheless, most climate models suggest that mean global temperature will increase 2°–5°C during the 21st century (Fig. 48.7). That increase is not expected to occur uniformly throughout the globe. As has been true during the past 50 years, changing circulation patterns may cool some places and warm others. Likewise, rainfall is likely to increase in some areas, and decline in others.
Climate can be considered average weather over a long time interval, but from one year to the next, weather is tremendously variable—there will be cold years and warm years, wet ones and dry ones. Because weather is so variable, evidence for climate change comes not from individual weather events but from records kept over decades.
Models predict that rainfall patterns should change as Earth warms. To test this, oceanographers analyzed 1.7 million measurements of seawater salinity taken over the past century. The oceans were chosen because they contain 97% of our planet’s water and receive 80% of its rainfall. The salinity of surface seawater reflects both the addition of freshwater by rain, which decreases salinity, and evaporation, which increases it. For this reason, changing salinity can indicate whether the balance of rainfall and evaporation is shifting over broad regions of Earth. Consistent with many model predictions, wet areas of the Earth are becoming wetter and dry regions drier.
Question Quick Check 2
TvPiOVsUEi8K34pMP9A8QLw6s4N0dmJ4tJjjyz1aDlvAvAGmRBqOCoXH71mr3zF7IIGN9YXN/yHdL8nIouWC/jt1EKtoGqDEopwL7A==48.2.2 Changing environments affect species distribution and community composition.
What will be the consequences of climate change? Without question, some locations will benefit. For example, the increase in temperature in New England will mean a longer growing season. Other regions, however, will suffer. As precipitation patterns change, many places will become drier. Indeed, a number of climate models predict that some of the strongest declines in rainfall will occur in regions that currently produce much of the corn and wheat that feed the world. Already, farmers in southeastern Australia have experienced the worst droughts in a century, and with them unprecedented damage from brush fires. Over much of North America, 2012 was also the driest summer in many decades. Such events are consistent with model predictions, but because of the great natural variability of weather, they do not by themselves confirm climate models. Scientists will be watching carefully to see whether such extreme events increase in frequency in coming years.
To understand how different species will respond to global climate change, we return to the basic principles of ecology and evolution. Natural selection describes the changes in allele frequencies that result from the interactions between individuals of a population and their environments. We tend to think about natural selection in terms of individuals’ adapting to a constant or slowly changing environment. In the 21st century, however, the environment will probably be a rapidly moving target, and so genotypes that conferred high fitness in the past may not be the most advantageous in the future.
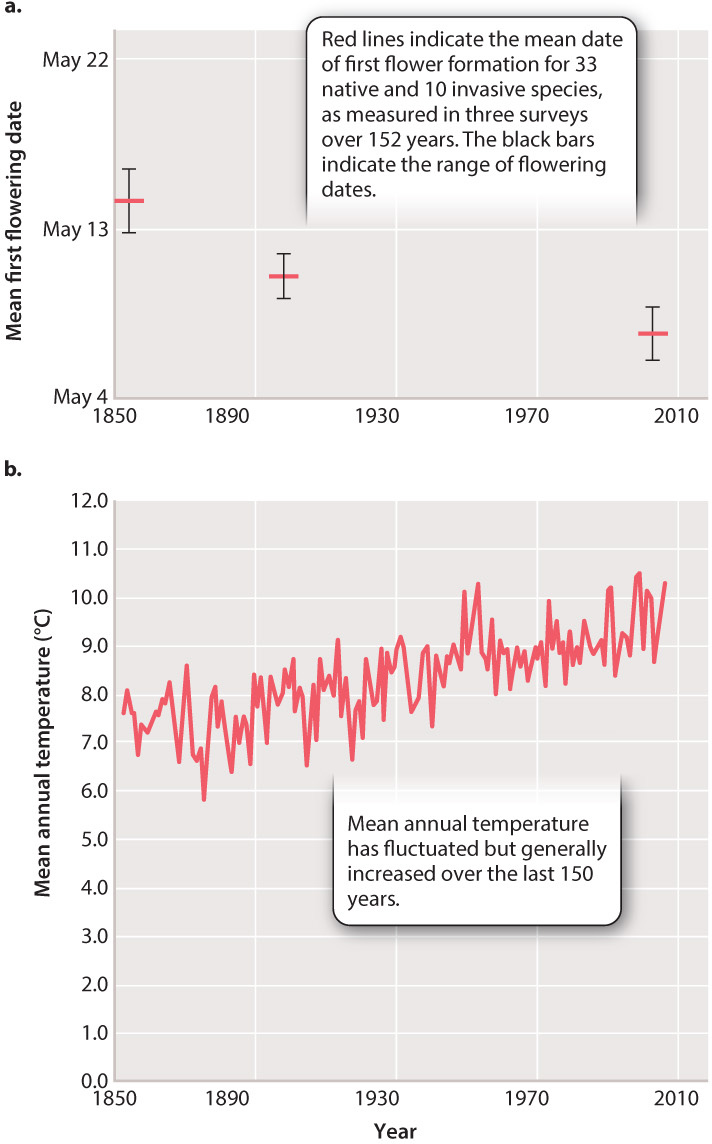
Plants illustrate the complicated ways in which organisms respond to environmental change. Meticulous notes taken during the 1840s by Henry David Thoreau record inventories of plant species diversity in woodlands west of Boston, Massachusetts. Climate records show that mean annual temperature in this area has increased by about 2.5°C since Thoreau began his survey, and in response, many but not all species now flower a week earlier than they did in the nineteenth century (Fig. 48.8). A number of species have declined in abundance or even disappeared since Thoreau’s time, and these tend to be the plants least able to change their flowering time (Chapter 30). Earlier onsets of leaves, flowers, and fruit have been documented in locations distributed widely throughout the temperate zones of North America, Europe, and Asia. The Massachusetts example highlights the simple but important observation that different plant species respond in distinct ways to changing climate, favoring some populations over others.
Question Quick Check 3
lwkhQ0J1I2EiLzk+EHLnDf/AnjoilwlsQiqqtZsBqdArrNRj/fiVQgDUSr0YRsJMTHsKU67Ld0IXIO//8/mo0jSdZbW+mEjREqY6juq+p30vOnruBSUIe8sM5KEA3XG0VizOBIzljsNQQucb7B73rd8a25I=The example of Thoreau’s woods shows that as climate changes, some plants can modify flowering time—a physiological response to environmental cues that now occur earlier in the year. Experimental evidence also shows that many plants also show a direct growth response to elevated CO2. Plants grown in air with CO2 levels like those predicted for the end of this century often change the way that they distribute the products of photosynthesis to different organs: The amount of nitrogen in plant tissues commonly declines, as does the proportion of resources devoted to reproduction. Again, this doesn’t reflect genetic change, just a physiological response to altered environmental conditions. But if environmental change persists for a long time, as predicted, the varying abilities of different plants to respond physiologically will result in changing allele frequencies, as some variants survive and reproduce better than others. That is, plant populations may evolve by natural selection in response to climate change.
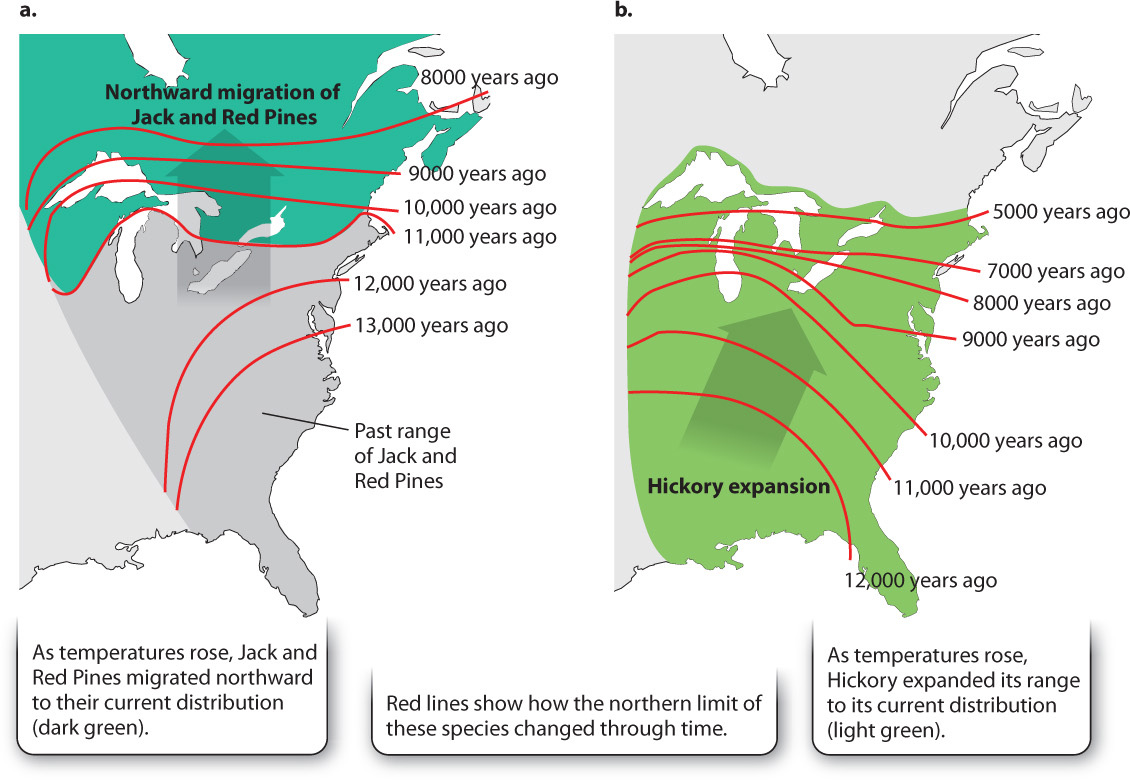
Evolution is one response to global change, but given the pace at which atmospheric composition and climate are changing, many populations may not have time to adapt. In this case, populations will either migrate or become extinct. Fossils deposited as Earth’s climate warmed at the end of the last ice age show that many plant species dramatically changed their geographic distributions in response to past climate change. As discussed in Chapter 30, trees don’t move, but they can migrate by dispersing seeds to new areas (Fig. 48.9). For example, between 18,000 and 8000 years ago, Red Pine and Jack Pine migrated thousands of kilometers to the north from the Gulf of Mexico, where they lived during the ice age, to their current distributions in the northern United States and Canada (Fig. 48.9a). Hickory also migrated northward, expanding its range rather than simply shifting from one place to another as ice retreated and climate warmed (Fig. 48.9b).
Migration is a potentially important response to environmental changes projected for the 21st century, but it requires a continuous route to get from one place to another, and it is a challenge to find these direct paths on continents broken up by agricultural lands and cities. For this reason, some conservation biologists advocate “assisted migration”: the deliberate transplantation of plant populations from existing habitats to new ones more favorable to growth. To make sure that assisted migration does more good than harm, we need to do more experiments to understand how plants grow and compete in new ecological situations and under different environmental conditions.
48.2.3 How has climate change affected coral reefs around the world?
Case 8Biodiversity Hotspots: Rain Forests and Coral Reefs
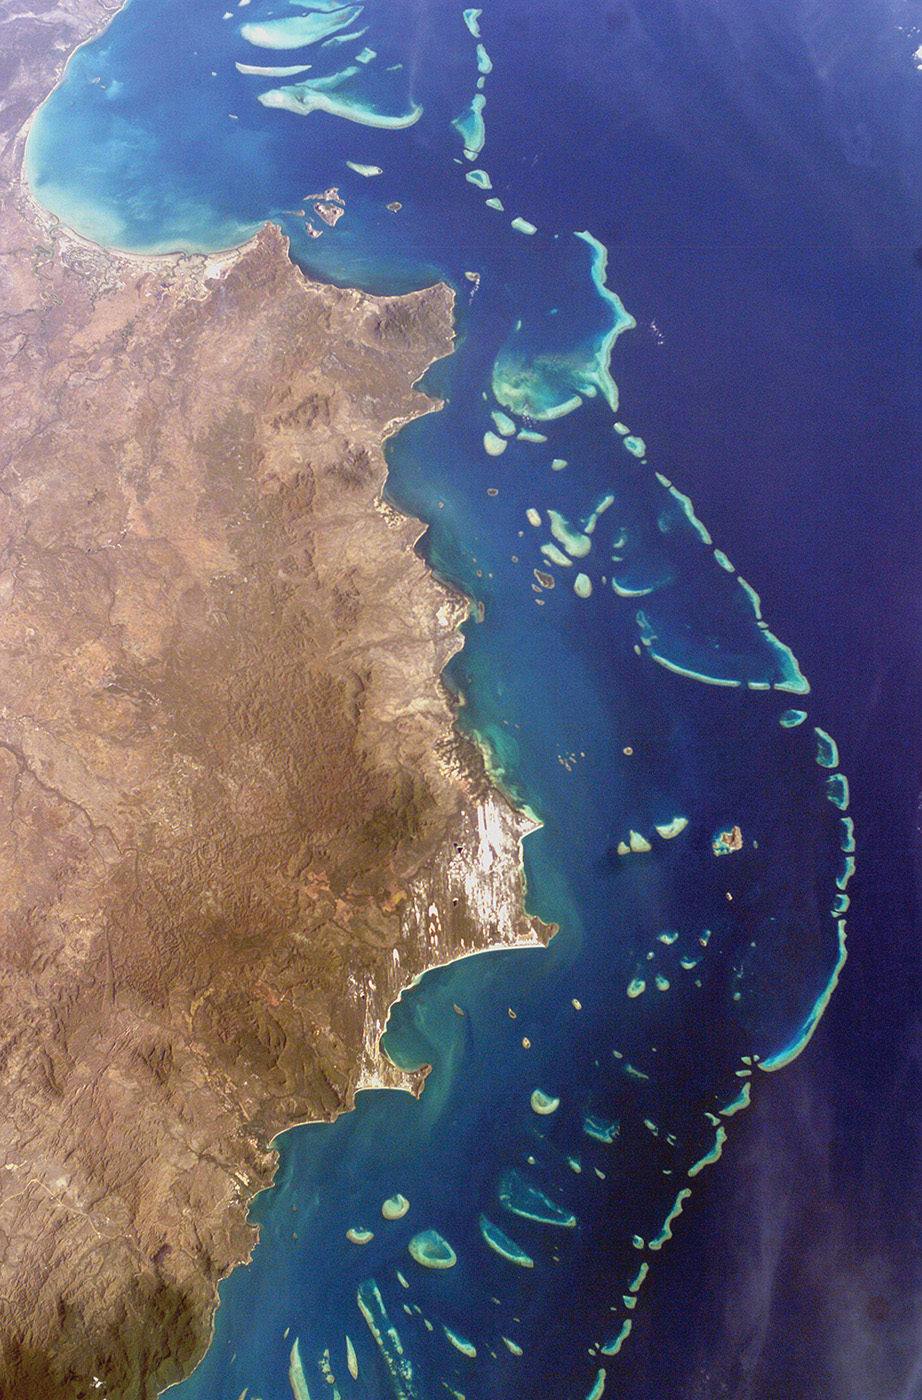
Increasing atmospheric CO2 is not just influencing life on land. It is also having an observable impact on organisms in the oceans, not least on coral reefs that provide hotspots of biological diversity in the marine realm. The Great Barrier Reef is visible from space, its wave-washed necklace of limestone stretching more than 2000 km along the northeastern coast of Australia (Fig 48.10). A global diversity hotspot, the reef’s 1500 fish species (a tenth of all known fish in the sea), more than 4000 kinds of clams and snails, and myriad other species, prompt basic questions about ecology and diversity, many of which we have addressed in previous chapters. Lately, however, one question has come to dominate scientific discussion of the Great Barrier Reef: Will it exist a century from now?
Corals are the principal architects of the Great Barrier and most other reefs (Chapter 44), and so coral biology is the key to understanding both the reef’s unusual diversity and its vulnerability in the face of climate change. Most reef corals gain nutrition from unicellular algae that live within their tissues. The algal symbionts in reef corals provide food for their host, receiving nutrients, waste disposal, and a stable environment in return. It is the efficient cycling of carbon, nitrogen, and phosphorus between corals and their symbionts that underpins the biological richness of coral reefs. Reef corals accomplish another noteworthy feat: They make skeletons of calcium carbonate (CaCO3) that build the reef’s three-dimensional framework through time.
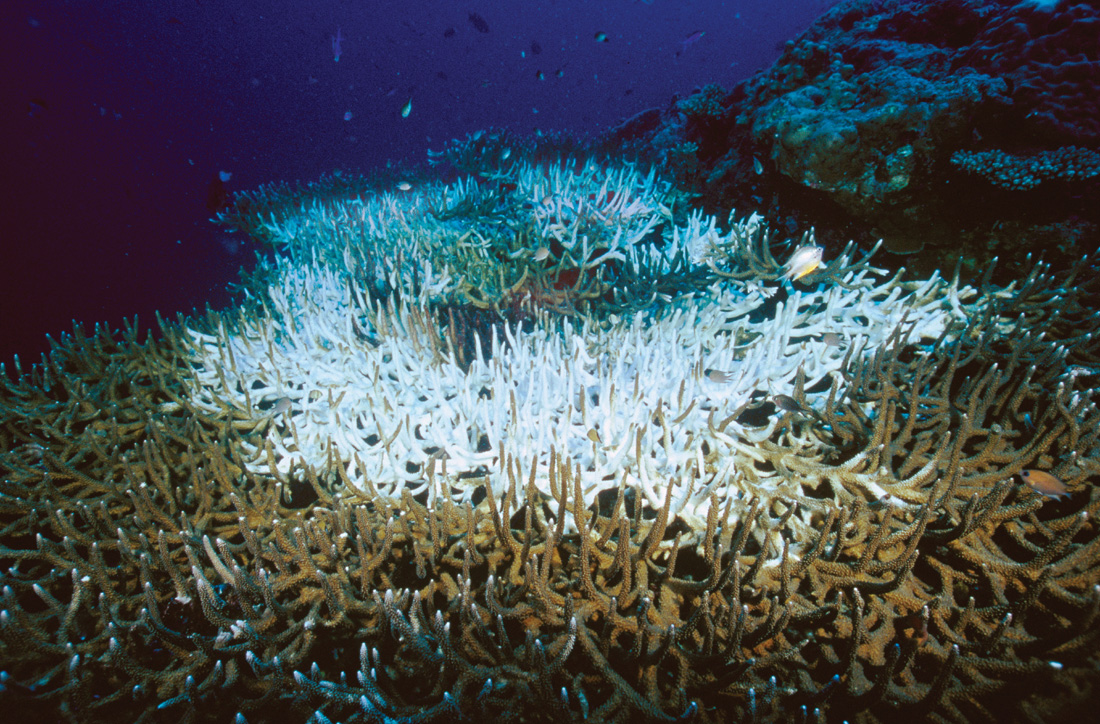
The very processes that facilitate reef growth—biomineralization and microbial symbiosis—are exposing their Achilles’ heel in the 21st century. Today, on the Great Barrier Reef, throughout the Caribbean, and elsewhere, corals are dying. Bleaching, indicated by the white skeletons of dead corals, occurs when the symbiotic algae that feed the corals abandon their hosts, thereby sentencing them to death (Fig. 48.11). The details are still being researched, but the increase in seawater temperature appears to signal the algal exodus. Increasing seawater temperature also facilitates the spread of infections that can kill coral.
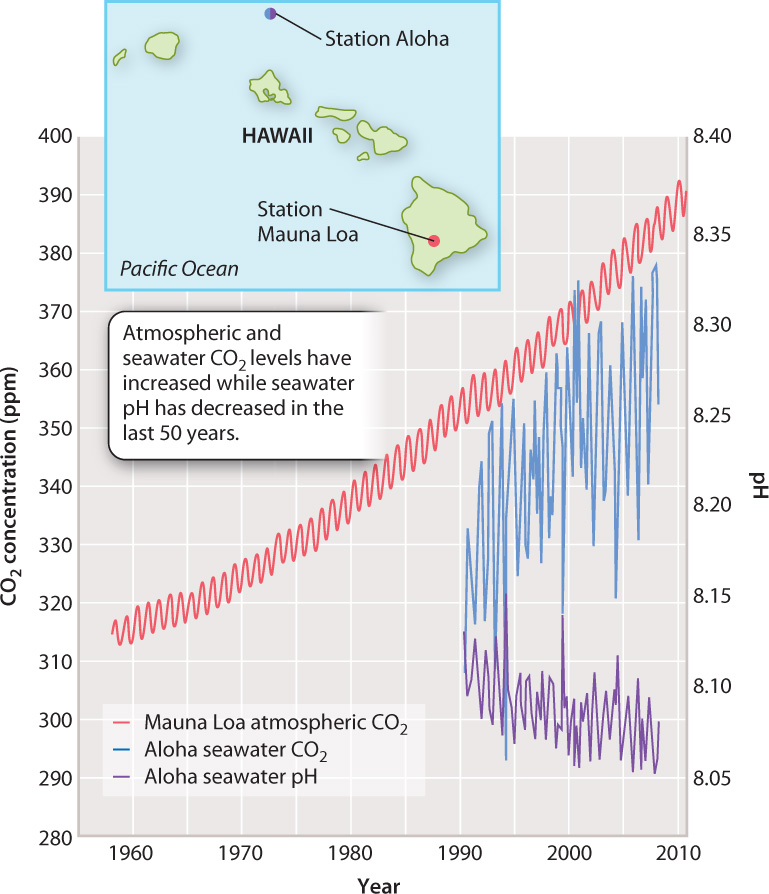
A greater long-term threat, however, may come from increasing CO2 levels in the ocean. As noted in Chapter 25, not all the CO2 produced by humans during the past century has accumulated in the atmosphere: About one-third has been absorbed by the ocean. That’s good news for slowing global warming because it means there is less CO2 in the atmosphere to trap heat, but it is potentially bad news for marine habitats because CO2 is a weak acid (Chapters 6 and 39). Unlike climate change, the effects of increasing CO2 on ocean pH are straightforward: Increasing the abundance of CO2 in the oceans causes the pH of seawater to go down, a phenomenon known as ocean acidification.
In the past 40 years, as the concentration of CO2 in the atmosphere has grown from about 315 to more than 390 ppm, the pH of surface oceans has correspondingly dropped by 0.1 unit (Fig. 48.12). That may not seem like a lot, but remember that the pH scale is logarithmic, and so the 0.1 unit drop represents an increase in hydrogen ions of about 30% since the Beatles recorded their first hit song in the 1960s.
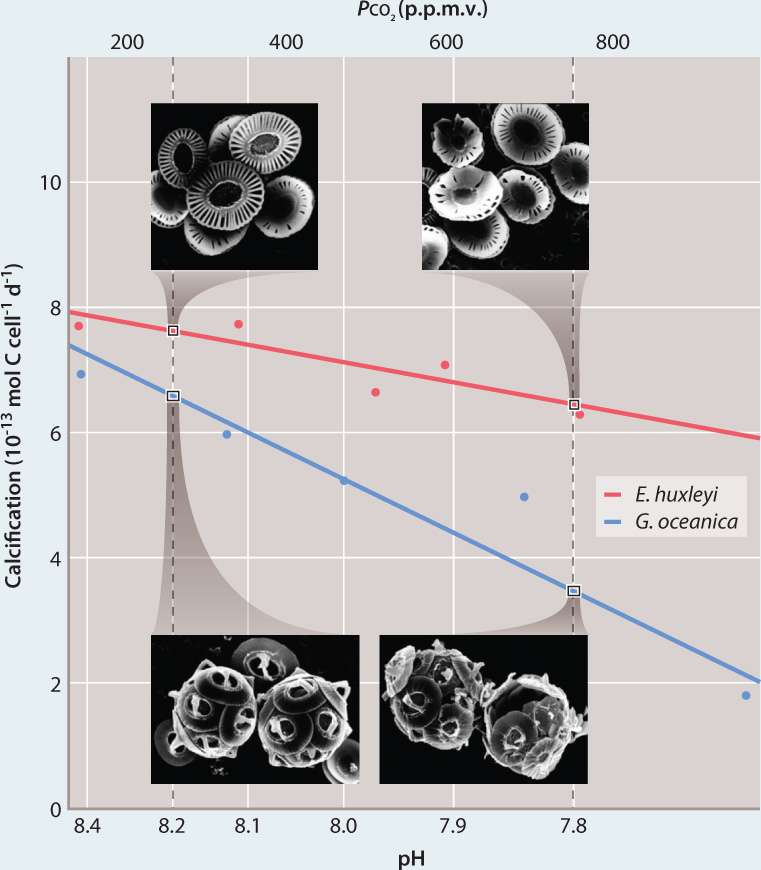
Ocean acidification causes carbonate ions in seawater to decrease, making it more difficult for corals to build their CaCO3 skeletons. In 2000, the German biologist Ulf Riebesell and his colleagues grew coccolithophorids, tiny marine algae that form scales of calcium carbonate, under experimental conditions approximating pre-industrial, present-day, and predicted 21st-century CO2 levels (Fig. 48.13). They found that decreasing pH had little impact on growth rate, but rates of carbonate precipitation declined markedly. Apparently, the algae had difficulty producing skeletons of calcium carbonate in lower pH. Motivated by this result, many laboratories have explored skeleton formation under conditions of ocean acidification. Researchers have found that some marine organisms can regulate the ionic composition of their internal fluids to counter the increased CO2 in their environment and so precipitate calcium skeletons normally, but other organisms, such as reef-forming corals, cannot.
48-9
FIG. 48.13: What is the effect of increased atmospheric CO₂ and reduced ocean pH on skeleton formation in marine algae?
BACKGROUND It is well established that atmospheric CO2 levels are increasing, which in turn decreases the pH of ocean water. In the late 1990s, experiments showed that a decrease in pH affected the ability of some marine organisms to build skeletons made of calcium carbonate (CaCO3). The German biologist Ulf Riebesell and his colleagues carried out experiments to investigate whether ocean acidification affects algae called coccolithophorids, which account for the majority of carbonate precipitation in the ocean.
HYPOTHESIS From the effects of decreased pH on CaCO3 skeleton formation in other marine organisms, Riebesell hypothesized that increasing CO2 would interfere with skeleton formation in coccolithophorids.
EXPERIMENT Riebesell and his colleagues studied two species of coccolithophorids, Emiliania huxleyi and Gephyrocapsa oceanica. They grew both species in the laboratory under conditions of increasing CO2, from pre-industrial levels, to present-day levels, and then to levels predicted for the future. They measured pH and rates of calcification and used scanning electron microscopy to observe skeleton formation.
RESULTS With increasing CO2 and decreasing pH, they observed decreasing rates of calcification as well as deformed and incomplete coccolithophorids under the scanning electron microscope.
CONCLUSION The results support Riebesell’s hypothesis: Ocean acidification interferes with normal skeleton formation in marine plankton.
FOLLOW-UP WORK This work has been extended to investigate the effects of ocean acidification on skeleton formation in corals and other organisms. For example, the Mediterranean coral Oculina patagonica grows normally at pH 8.2. When grown at pH 7.4, however, the coral skeletons dissolve. Upon restoration of normal conditions, the corals resume skeleton formation. This experiment shows that corals might survive ocean acidification, although the ecosystem benefits provided by reefs would be lost.
SOURCES Riebesell, U., I Zondervan, B. Rost, P. D. Tortell, R. E. Zeebe, and F. M. M. Morel. 2000. “Reduced Calcification of Marine Plankton in Response to Increased Atmospheric CO2.” Nature 407: 364–367; Fine, M., and D. Tchernov. 2007. “Scleractinian Coral Species Survive and Recover from Decalcification.” Science 315:1811”1811.
Essentially all attempts to model our environmental future predict that by the end of this century, atmospheric CO2 will rise from its current level of nearly 400 ppm to more than 500 ppm, and changing pH in many parts of the ocean will limit the ability of corals to build skeletons. Some corals can survive this change. For example, experiments on two Mediterranean corals showed that at a pH level 0.8 units below the present level, the corals grew naked—essentially as sea anemones—and recovered their skeletons upon return to normal seawater. But if ocean acidification persists over timescales much longer than coral generations, the structural framework for tropical reefs may be irrevocably lost.
48.2.4 What can be done?
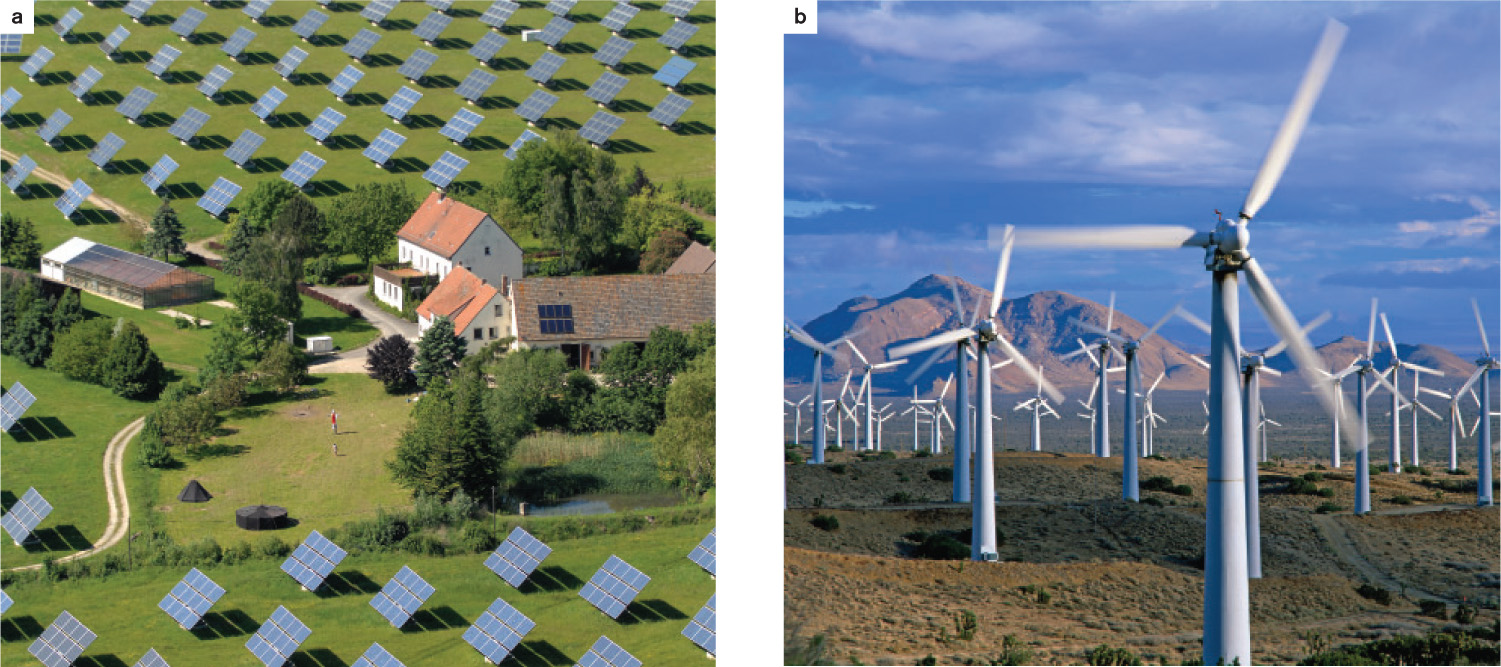
From the preceding discussion, it is clear that rising CO2 has both direct effects on the physiology of land and sea organisms and indirect effects related to climate change. In order to ensure our environmental future, scientists must understand the climate system and biological responses to global change much better than they do now. Because the principal source of rising CO2 is the burning of fossil fuels, the solutions we develop as citizens, however, will clearly focus on energy—how we obtain it and how we use it. As the global population continues to increase and people aspire to higher standards of living, human impact on the carbon cycle will continue to grow, at least if we continue business as usual. Business as usual, however, may not be a viable option for the long term because population growth may simply outstrip resource availability, especially for petroleum. Ultimately, our success in both slowing rates of global warming and sustaining energy supplies will depend on our ability to use energy more efficiently and generate new forms of power, most likely from the sun, wind, and nuclear sources.
Half a century ago, geologist M. King Hubbard predicted from patterns of oil use and the rate at which new oil fields are discovered that petroleum production in the United States would peak in the 1970s and decline thereafter. Global production, he suggested, would peak later, in the early decades of the 21st century. King’s predictions proved accurate for the United States: Domestic petroleum production peaked in 1972, although petroleum use continues to climb. In addition, global petroleum production also seems on course to fulfill Hubbard’s predictions, although the timescale remains a contentious question. Coal, natural gas, and unconventional reserves such as the oil sands found widely in western Canada can quench the world’s thirst for fossil fuels for another century or more, and biofuels—fuels generated from plant biomass—may also help conserve petroleum, but the energy produced will be expensive and global change will continue.
Like fossil fuels, alternative energy sources—wind, the sun, tidal energy, and nuclear power (Fig. 48.14)—all have important pros and cons, not the least of which, in the case of nuclear power, is long-term storage of radioactive waste. On the other hand, all these sources have the potential to benefit humanity at least three ways: by reducing the amount of CO2 emitted per kilowatt of energy generated, by conserving finite natural resources, and by helping to contain the cost of energy production. The development of more fuel-efficient cars, airplanes, and buildings will also help us to maintain energy-intensive lifestyles while decreasing their environmental consequences. As individuals, we can choose energy-efficient transportation and appliances and develop habits that decrease energy waste. When one person turns off the light in an empty room, the energy saved is tiny, but when millions of people do it, the benefits add up.
Wise choices by citizens and consumers can slow the growth of atmospheric CO2, but the CO2 already there isn’t going to go away quickly. As noted earlier, we have dramatically increased the rate at which CO2 is added to the atmosphere, but we have not changed the rate at which it is removed. The geologic processes that control atmospheric CO2 work on longer timescales. Therefore, even if we could cut CO2 emissions by 90% tomorrow, CO2 would not return to nineteenth-century levels for hundreds or even thousands of years.
Another possibility is to actively remove CO2 from the air. Reforestation of previously cleared landscapes removes carbon from the atmosphere since plants build biomass from CO2 during photosynthesis (Chapter 8). It is also possible to capture CO2 as it rises upward through smokestacks, although it is expensive to do so currently. We do not yet know how to scrub industrial exhaust of CO2, but if CO2 could be removed from the air in this way at reasonable costs, it could apply a significant brake to global warming.
Clearly, forestry and 21st-century technology have potentially important roles to fill in undoing the consequences of the past hundred years. For the most part, however, gaining control over our environmental future will entail wise personal and governmental choices about how we obtain and use energy.