Chapter 1. Mirror Experiment Activity 1.18
Mirror Experiment Activity 1.18
The experiment described below explored the same concepts as the one described in Figure 1.18 in the textbook. Read the description of the experiment and answer the questions below the description to practice interpreting data and understanding experimental design.
Mirror Experiment activities practice skills described in the brief Experiment and Data Analysis Primers, which can be found by clicking on the “Resources” button on the upper right of your LaunchPad homepage. Certain questions in this activity draw on concepts described in the Experimental Design primer. Click on the “Key Terms” buttons to see definitions of terms used in the question, and click on the “Primer Section” button to pull up a relevant section from the primer.
Experiment
Background
In nature, populations of organisms can evolve. As you will learn, evolution depends on the occurrence of mutations, or changes in the genetic material of an organism. In rare instances, a mutation can actually benefit an organism. Mutations can allow organisms to exploit a different food source or survive in different environments. A beneficial mutation can randomly occur in a single organism, which then produces more offspring than organisms lacking that mutation. Thus, a mutation can be “selected for” in a given environment, and the frequency of this mutation increases in a population over time. This is one way that evolution occurs in nature. Can populations of organisms grown in a laboratory under unchanging conditions also evolve? Even without dynamic environmental changes, or interactions with other species, can a population of organisms evolve and acquire new traits?
Hypothesis
As discussed in Fig. 1.18 in the book, the work of Elena and Lenski demonstrated that evolution can occur within a laboratory setting: When grown under succinate-rich conditions, populations of E. coli bacteria (which cannot normally use succinate as a food source) can evolve to successfully metabolize this compound. But was this an isolated event? Could researchers provide other examples of evolution within the laboratory? Zachary Blount and colleagues asked just this question. They hypothesized that if populations of E. coli were grown in media that contained a small amount of glucose (the typical food source for this bacterial species) and a large amount of citrate (which cannot normally be metabolized by E. coli), populations of E. coli would evolve that could successfully use citrate as a food source.
Experiment
When cultured in a laboratory, bacteria are typically grown in a petri dish coated with a jelly-like nutrient mixture, or medium. A single bacterium replicates to produce genetically identical progeny, or clones, of itself. On a petri dish, a single bacterium and all of its clonal progeny constitute a colony, which appears as a dot on the petri dish. To create new bacterial colonies, a researcher can dip a toothpick into a founder bacterial colony and scrape the toothpick (in a zig-zag manner) across the bottom of a new petri dish. In this way, researchers can continually grow bacteria, and assure that they have enough bacteria to carry out experiments.
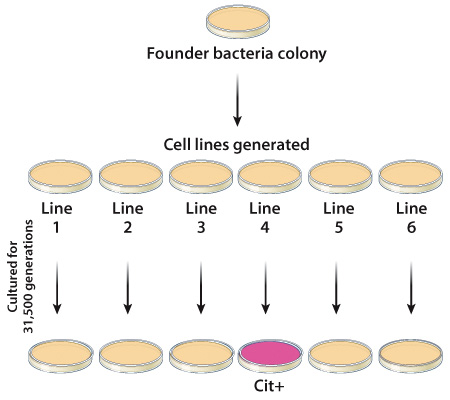
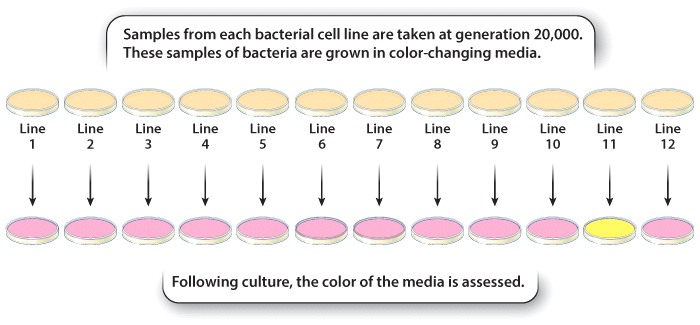
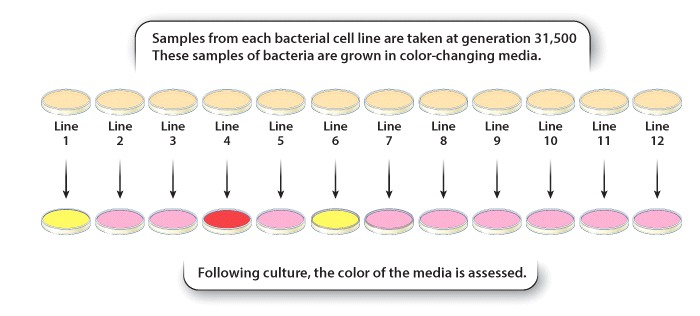
To begin their research, Blount and colleagues isolated two founder bacterial (E. coli) colonies and grew them in petri dishes. Together, these original colonies each gave rise to twelve new bacterial colonies or bacterial cell lines. Samples from each of the twelve E. coli lines were grown in petri dishes containing a limited amount of glucose, but large amounts of citrate. Researchers grew bacteria from all twelve lines for over 40,000 generations, removing and freezing samples of the E. coli cells every 500 generations (to be used in future experiments). Each bacterial line was periodically evaluated for its ability to use citrate as a food source (Figure 1).
Results
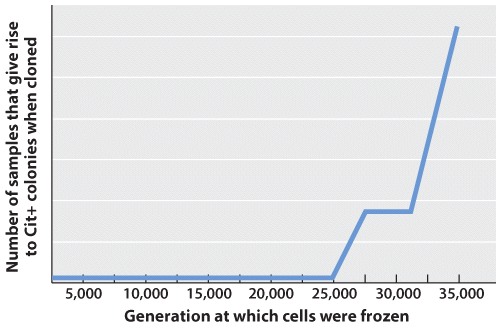
After 31,500 generations, Blount and colleagues determined that one of their bacterial lines had acquired the ability to use citrate as a food source; these bacteria were designated as Cit+ (Figure 1). Over time (by generation 33,000), these initial Cit+ cells became much more efficient at metabolizing citrate. These results provided further evidence that evolution could occur in a laboratory setting.
Source
Blount, Z. D., et al., 2008. Historical contingency and the evolution of a key innovation in an experimental population of Escherichia coli. Proc Natl Acad Sci U S A. 105, 7899-906.

Question
fM4hX8gTL8U/lHyDDFl0oGaObGhjB9wT/5X2Bm5hp9syrJzB6eVuBDVPwiW5XdCYojG4MTUwPSbHBtci6fAuUVZwgy23ObNvqKBq2YM8evcAZQpkjZv3QxvG5YN72ge0YkqdPWVY/PyrjiB1XMCItj316oy3nHYiiMeAYBGRQb2XIH+BWZJKPn0I0cbGo0n9H4lzshGphnCnZeppWSJrSqB0lU92MIK7UEs5n+7+5kRiWIx8KX5/N4XhsjeFQ7rZMcDINOEbW5pHg0Kd4x7b/Ul2BiJ59UfAN6dziXrju7PKaPRNRzcV/IalRdkO8tifsgrg1S/XyqLtVhdM6wvh64Jx+Tzo3TK28oa4GwrrFXLzfs2iBlQnjyMjKm76PKU1P0iOpde18AUkTxCco5ZeyaUMEDijlNCchPDWv339If3cT+NGbfny07vcxQOaZ60U0cHL2QAcE9C2XeGfZwT4dheT8dAJqxNus7i/qjg9vz97bJj9R4kzU5AOic7YB5l2nIpT++gzrqtuPOXPJCji+VbPHnVvoi2vIHg+io6E5awEXc/dfr6FeEMKPWZrWfo5QsHalXH4P5IMlMO+7+Qp7hUEi5p9kXx+8IqMpAiCUpm2pk/bZsOkYo5dGT3FNE8undnTR8t1b+YgDzR6Spf8MVgeBREytBvN1nAs38BD/bHzvs+fhzq4GCoA3/xFZIiiN+qd0FpLmvXe8kUDNVvytmrmI6aPxDaRqhSZzl+ue1s7Z85kj0Zjm7KOujHgD02znySA/Pu39vLnqjCTBbdNDPg/B272FfIP0Qc6+r5QMt8dfish+zr5dQg8vxpJlWCDQ1iPPrso0Xsq70Ckzq4CkSkUS74dDN5mYw92xZ5LsDWXkBRt3rbSyNZ9E+/OKp90w8luFZmUVBPFFa0DalN4kZqqbiLZMinzxE1vRREFxJQipwkoIRaIQGQ3mn6/NeNC8eAyTwlpvizOfEYSxP7KHfIBg88U5mMF09LtNAmlPSXKVCnKr/APMGrjgwqTg3vqP8NauPTVW6qlipH+k2fZOR9jUiSsZRPMJk4Ruwa+gXOkcEQkW2lxpJ+d52JO8gNXLTeUNx5qMrQIWyWILpJdLKhFMbxR1qm2LTpmx8xuHAym3iqdc2pUrLG4uxmU2H6MkOhhxLzYibGn7haxFci7IFtOu0mqbhOEE68gbC80w/WKZ+Txrhohl5fUaguX8X7S9O0dfgMjP2O6JO+OfwzzWRdDunLsaBFAQwUOGSv/f8eo6/5EKlBfuBUEEJsR3AUymftHXt0h3QVZYvf0Dr9o6K8upX9kRxkY+sxxVo7PFJUpes1vo1TMqOSCJAHUR2zS4Eea/zXDfiqLBsiSUrUeFFJ+vzBgoEikTId6IzOclNlEjwsVSdlCl+fEwgPIYit6m7rZg7BNqhJid6jVYy8KTtAM1ls47/M76noK/nk8LWwuEcntT4AU4QdSEWQ5w8Ak46ozp3zdQEcHsf8ci8S9pCaLtjlZIuugKJrDPcYpybfXE9wIfix8DvePQsJ7b9cophCvqx6S+4P1Zfes/aDXrXdENQuo+7tBgCOwYo0wsRLPZoceIJ0NVr5r9HWRbwQBa8D5F4f8jmYAcaWkkxT+3ZvMN3VB9YNsSrYOTl4opzD5dqO1NIK0TG4TV2JKJM7TmesnpeLrTZcWncZVCi2CGYvsuZwQSvTfxdbn+Q/foCNmGKo/3YCjEejEM4Zp8xY63tMkGOf98QPPMwREiihAMq4eT/1LSNjObkV8MXTnZBLUeF20fLGY8JZQ54cKHbTB1CBQc6lBgtB5SZC1Et4e8cd+fZUANp1WplOjyS2+xO132UR4ETLStTPhoLgke6saiAMvTaAvpynsXZszO1GeIjUBfVHnXuLP+6dpugVlzfEj/e/CWSQliF6Gr2QYaq9sGf+M0zhTvAoTK65GPsZE8jVUXY7NDEMJHf10Lwe46idK/THnt8+1Zdh9/c/xjBYlq3ePnKqzEm07vHVfJUl1jcCKfmwTuytphHPxBqCQVqU47ysmnA0ow9FaDo7qcpT5USqwvCoUMRErVXatQp9mZ1bvsL09PXh+u60xtZlZKpwpv179LyORyG3A8T1vMKZAP817CDO6YPRk04p2wI4fLuzfFht3SmJFcWZaGx6zFkvg3YLSsgKbVfgkyg7jrFs3sN7ISTCdyv0sInzQYgJYI04ayGVk4A7cX1AvLNDqe0lin1+oVh7rOl3tangh1IgVShy7+giQxEeZv7F0k1E2SqrEsJVplrRb9FRGtcNOPc0=| Positive control | A group in which a variable is introduced that has a known effect to be sure that the experiment is working properly. |
| Negative control | A group in which the variable is not changed and no effect is expected. |
| Test group | A group in which a single variable is changed, allowing the researcher to see if that variable has an effect on the results of the experiment. |
| Variable | A quantity, feature, or factor that can change or be changed. |
Experimental Design
Testing Hypotheses: Controls
Hypotheses can be tested in various ways. One way is through additional observations. There are a large number of endemic species on the Galápagos Islands. We might ask why and hypothesize that it has something to do with the location of the islands relative to the mainland. To test our hypothesis, we might make additional observations. We could count the number of endemic species on many different islands, calculate the size of each of these islands, and measure the distance from the nearest mainland. From these observations, we can understand the conditions that lead to endemic species on islands.
Hypotheses can also be tested through controlled experiments. In a controlled experiment, several different groups are tested simultaneously, keeping as many variables the same among them. In one group, a single variable is changed, allowing the researcher to see if that variable has an effect on the results of the experiment. This is called the test group. In another group, the variable is not changed and no effect is expected. This group is called the negative control. Finally, in a third group, a variable is introduced that has a known effect to be sure that the experiment is working properly. This group is called the positive control.
Controls such as negative and positive control groups are operations or observations that are set up in such a way that the researcher knows in advance what result should be expected if everything in the study is working properly. Controls are performed at the same time and under the same conditions as an experiment to verify the reliability of the components of the experiment, the methods, and analysis.
For example, going back to our example of a new medicine that might be effective against headaches, you could design an experiment in which there are three groups of patients—one group receives the medicine (the test group), one group receives no medicine (the negative control group), and one group receives a medicine that is already known to be effective against headaches (the positive control group). All of the other variables, such as age, gender, and socioeconomic background, would be similar among the three groups.
These three groups help the researchers to make sense of the data. Imagine for a moment that there was just the test group with no control groups, and the headaches went away after treatment. You might conclude that the medicine alleviates headaches. But perhaps the headaches just went away on their own. The negative control group helps you to see what would happen without the medicine so you can determine which effects in the test group are due solely to the medicine.
In some cases, researchers control not just for the medicine (one group receives medicine and one does not), but also for the act of giving a medicine. In this case, one negative control involves giving no medicine, and another involves giving a placebo, which is a sugar pill with no physiological effect. In this way, the researchers control for the potential variable of taking medication. In general, for a controlled experiment, it is important to be sure that there is only one difference between the test and control groups.
Testing Hypotheses: Variables
When performing experiments, researchers manipulate the test group differently from the control groups. This difference is known as a variable. There are two types of variables. An independent variable is the manipulation performed on the test group by the researchers. It is considered “independent” because the researchers could choose any variable they wish. The dependent variable is the effect that is being measured. It is considered “dependent” because the expectation is that it depends on the variable that was changed. In our example of the headache medicine, the independent variable is the type of medicine (new medicine, no medicine, placebo, or medicine known to be effective). The dependent variable is the presence or absence of headache following treatment.
In designing experiments, there is an additional issue to consider: the size of each of our groups. In order to draw conclusions from our data, we need to make sure that our results are valid and reproducible, and not merely the result of chance. One way to minimize the effect of chance is to include a large number of patients in each group. How many? The sample size is the number of independent data points and is determined based on probability and statistics, the subject of the next primer.
Question
CSLAUScrgtymORMh4UBC4+MBlCR3g5pO8wmbfe+IVUvRJHBHJvDscTf1BRyT48leN3qRFU7t5NqkhfiSOGDusN4UEegktXjZK8FwgrxcmaTIdJyaEY6gIp1WhQ0qWe19xM9Ki1h3Ol8Tt5sj/SfRQXX7UBHvHcW+80z+EbdQmeM5w1yO+WO5JDbYCLWw934yeXVn7SUGk2swXlVtsQagZrRjuFKamEgmz/cm926orLCbEGO6imwtZxPihXPnQQYcHc9F2Hja/XnlW+RjvSvhmpQX+G9zRnKfxqHgrAprqqFM9qYbILUDJ6w0xCc02RsWWl8YLOyDpCd+s5olWFjSgydd0nXtHB5wbBej35u6jujkYieUjAoBm/CM9ulPfWlAp59wLfn8jaLHlr0MOkvJGr2LmL8NyC7HhumAamNj2GiOAtNqGQ1geOGa5vdPrsRiC4OAgJRCJpL4kYkvEw17LJ5Jb61P11pnEVgFHHzvq1gJWTuxehitw/ekVpV1YSHqEPWfVk2W2Qx3d6VsrnEUhVLLa5X1nDZDPeWDaIvUElvXGsmZIl0Fl67b4YN1g65IMZLp+vryyw1O8Hr2qnw1TUCKIAjRBAF1WNGoDwnFOdb7XwqZvD2XnEz/TEVDav5xS2kTtrLuzsldSYKLMp+LqE4wX2zlhVAnhNSISfbdqebwGa81JYD2cjKmiuwlJArUtm1+fFxxlokHWrv6yHB7D83pYu18Dwv7qY8LUr4YZunYQcqbM3lRoX6xLhup7SJE7uVobF6pmmZr5WEBVcJrFAFVHzrsUQ89RYF9/pyhiPVrLypSd729illnEIp4JGUaXu9pofdhrEu1i1P7cPNhcTYtEBgqUhAIznH4vIQoV4eTnVgRzsWEukCZ4y63Crnf7D5oHIc9Iam1xwgVPneG3fATOlgWdr+9uUDehu/x/cJWvAfDpdnAyiiAJbeqO7dnvLfNiwjOIuxFoVD84t6IP8T2/XXmJrfFT5vjmBu6KU2F64wEXIga7NHnE+RuVazIuppwohBufliHj6Fvj0bYHe2Xmt5C2zTl0pseM+jjWsusLZIlspN8kQ3GhGvu/AqyglQe8Zp3ty8cdOo+OEUjyJFzLhWNuqWgTO7VUJjFcI6kTIP1gOH7ftK8yas1lRJa3Y4HYhpv/PtQBrE2INTUy5m+uuKm7MElUbAqW/hMEF9JsFlCwbHJhF6CqOF8kYmTaYSi2lEnpHL+NWrZeAgJne+bUCgWFyB3TjeBRxcmh2Rk02stY3MCNTfF+h53goXzaMNL5zDhw3zuam1BJHeBhUJjNrfLgkyNzNZAc8H6CCqj3NatituATSNqOavBikirWCVslFFN1VTvjdE+UoqFzVggZuTSYKY+NutINDJ1T4QVt3BWiGTJHyxdjvVJI7sjPLC5DhfzgXWCOaXsZKUXPeseSLtVlViQ9Rw9dcW4y2s8TisEuHWzUlvZ1invVhxV3O4Vk2o5I/Wg7gPFvq9IJFbz1UD6wWOWKN9tIY2PMTw+MJwehkPjBzPnjht6+YYFUgHSTrD1X+4fUGTL09lBt2YIijFsq/xiO4eitPwY4UHH5SBoh4g0igEEt1X+tgHhIE9eOU97x3wUshRAeFHymkjIORbZ3AdfM2vnnbuq6ofaa3nCkdSMQuQJAS48GDcM43GQ5TSl9Er9w4DZ0pwnHDk7IHENsbU1mNMvXj5qlxkgVu/LkrJuMGpc9nmAjvV1aQ2V+pP9xZoWEBq7Wi3oTYq2HAukdOSA9V8O8nExobSfS/Yutq1O2hY4/BQqgL9B6lc/kkRc3H2okfaKqANGu97XxFqBvR0hNlw8Ephcz8P0yYLyhpyhQzIz8oInRGRknZZJgil9sNoxIzjMRRb0mwrVwP32TXLZkO1DLjvEsB/ofwUEREzDmNG0Ob/Ab4X79vpJCpk5zpoeJmHzph60jj1zwCJ/6rW6pL+FpwZPn/LL6e5nMmny5ZCxv5MxwNlD2fTZgPsFX5r963wQuhOqk93ZQM3al3vzXvixKi25xgsz3FYvxywEcgb3kdhklwkMgoG09Biy4Sm3CU0qCGzoglo/AbJSjOCraoDqfUl+RqSwmWjIFWsMn3yG0ysljH3DiQhc/Sgezsm8CeWp30u/LqBXY3+clyZCBxtsx3Jx5+NvRvUir66OgTMP1lQZESrfTwnZwVYAi9HK0SHLkACYHxctfIqEKjngJK+nBPAhLMXQao2YjDKCfvE9MGgv8G9imMaiUCiWtczcsJ4P9tPztiJLmrOLPKR05vfurceiX6wu9LpPpCd2Z7ZmG4A8JgwTfTxCf02FWdrJQmyYuYXXwzrCe/59mYjyu5X2kgum2by8f4xDLzwDjaPk13mXCvQBL8kud5fc9DeX3F3n6zFQDYGYDLfVkYR0AZopwEyv2hH0RfkUJ+L1RPiamzyVZcr6xCsV8rGNQHUOhUOugKgJxw3FnozMq9Euo1u/t0QVOo9AOhVhZzZTFF+hPcCT7kge7HxYmFUUxze0dtTIVgcHTIj5Iai3wO0FHA0UKJNwq6L64BfQn4dD/2DDb+RclmVinvYIbCWpp/rP74krIukGu1+8g34=Question
AKmiUaj8mHG+tJwV6NAnAf6iSYtNGBWNpuqdq9c5Bpg1pTWu+22oh9rIgF7aOuJamXYpFOTRSbcxZRnZB42+MOjaT3xb3YE4RUJnTaM09NSw1aNFlMBFuwCycfh2ES/rsJPC7R6acIfKw0QhQkMFfaUsgzD6/+EVmJ4YrRVfEIHvYTDi6wSdWOstKGW/be7NPJ7y4DqxJcakTYmCL6LtyeqmJ/yGg5o8a/iV3qrhASZzGa0a1qHJGbcwaScYoz1qrOzVVkiQ15ASscqVulzewByCtr+5YjIAjhl7OWmcZGATzK6AzZLla9sssHj+lUCDQd27M/wHU4sBf2d7/3P1jRr4MR+AldM9ZxQqSNOs7hh4EUuEFdPcDDuSzsnFMFg1shSj//kq0iuMKBgL4lZ2grkL8yq0sbCyEoFbW0cb6GPGBeayUcIe7X8MtT3qjyjx97B8eBBvqfLaUdIbQOkEQMGm1j+WmX4/uHbBSiNvIEVtuDgyD+wC7g+q+SYypQu7LSn3Pe8B0HYDEaC1avUY2zFJpmNjFD2ITzlsYGXR6wO/mKR8a6aHQwtxkknc78Of0jpCXnI5BFCVURicWqFrTzOsBBlVukjmFOfnhrrHN96i4msEVoN+lAteJ3tlw7j/ShhUYsKRr7EORTk1t+l6v7p0O0h0+T5GbZVcQf8MNj16p1Q8G9vcCZKwziVjd28GLuUJ7yELxyCA0Q2VpGW6MJxweZnYWPExMasNE6LL4dUsI6yKxMG2SwqAjIPinGEd38QCEI6yQ33l3ak/5zNXUEgSE7W4SkVkyMoSjLObDjc0QwzjlDqN9RYNRf4DKDxFIlKdOjO+UkOGDjeqjK8j/6pLKZ1raYfBFRmoseMiNr+I62EQ9syHg9oRhEA1ClF8cOuKBHOtc5qTrLoYdvqxzFbKmpbwiqDmNjpxkxUoY2BMbYQYlkR2jXm1HXQ9bARxXUaohkloMwMc7mQOW3eSzoD/OJdAYLCt7sI80xoAaabpJwN9A0tOmYHekCr+TORzjcJBSlcgGzCmtZR7knwIR8VDfOAtrCWLgrQyIHcjUDmtE/EEInFjQl4Bzz7+TyvxkoKhUu+aChxoRFI6QKnNqYWqt4FCeNG5eTITRbful1LlOKPkAokW70R+PZKQ0p8i++yWJiwgCEkPslyrE/o/L3MUmuU6r/zSewRUpe99DWelYvuGdFVLORS0tKs1txL9Ed7A6Wfi2bRpotGtkTrY6lgjJrxxRgK9L0IETsht4/uSffct7/guX0ismn64+9MXb3iw9mZ5bMBXAyCopvcIfOopket/Zqqx0WFcd6ruzaB3aEkQaFWZiZauQ1oVWHZOoqENTCnX8y+2TJDpuHlTMBCxRTyjSjjJCxbLExWi2wg6gcH8JXRO3TNlHU92X5ga2A8RxaxQ1vw4AyT1SPOx1kWpXJwf3hU8TBnxVBAlM5EGO+05XX8ULIDVoSwlGe4D5BrwI9zo3/niqBgctqF4O+XH8N0jAVUe1Wev/GJ7lwNHQWUHktmlzW5GE043H+mWQYAN/eN4T9rsK4N9jnJNT8E8w/WR8vfzaBjH/gKlJejSO1fbrdZ5FBXkUwVvD+5IyYHBE2W8T39JkaGlUhhThdQw0XxATapKjA5ioHwH0LP0d0gV/A6lIL0cMgt9DryxYcix2N/OW7C0Fj4drQJwSg2LWqj5CpxrUk4bRFhetds8DP9QwaLwre1tMikBKroqTEx2PGkP5ye96Gq1OIQY3I4TLFPo2HqrPcHwqL27oBAgY6qdawCQVhU6GWyZEYCewBniUm5Hq+QSK5goAcabmdS/3+cqdH2iIPRiXenmgLutF843XUWrHOKckuIbLi69UtGYgl/uyK4yWsa0ly8629fVJyGz9z8sewt1T8YRre1g1Njj+UvqbOYijdAM107NqGqtoS7juu6bI/p4eHIQn+AxFf/YxzZ0wHswNP1FXZXVJUB2g7JLZk+8flTzAWSde5ZS+q54rVAn5zobluOmbl3OktYIw7kLIBrs7jKxCKbxAHB2E6ky9u1ffub1iFzKT+09v4ssIH6rjJyW1g46Gn+cmYFC8OuB+eOI5bDmqGj7Vvb7Y1O+lDTVzNYgeVjMIPzuaFso5Q+UgzQLVsRmTU2urHLq0DIna0dv1Iqqh6qOe+Gc+MYd7imnrhrGrPjoTy1UZGfFIWfK9QaI5I9HqM7RSuxbyfuJG8BpzmarfYtdIBeMhaaPm9Mcr4UM9BOo9sIvdj0Cr7706jTQddvPCjk+77GXB/rMnQW96XOH9eK+hDh8fyUFhiJNINK3CHr01GQGdPLL7BlP9mqf+3JYQpwnUIUw89JO40pt0kQMYpUoUEZn6niPjFXwNzHLphFmXBLsJWHrmZAPQNcZOn30p29LGbceScxM1ld9tTVTtQrt+grIVTUU2f7al1KXD2+q6+nLawK68Dc=Question
btXlpTg5ChddRGLPZvVgJYiyOUWkMEc8fxioadx46XJ3I2inKMCBmHDrPNz1gQlWim0KAU8f078mcAUjD16H3dg/9nj5MCnpxJFWTuBCG9BvVNGZAN97pPOhB8qh5R5QR69mkgMaOjuoadIDLbrBKMnN1V296fSgdU1PCr3ItYpWSAcMYnniXjRwfAqR1MVFeb14kuvHjMCJiuL4HL53i5FPI+THD12PDixGZt5Rf0FCqVs5FY7gkVXTF7eTDXjKsDEp4TkbWbGLJ4SsXSazy2PDA6CJIq/i7kKcHZvx2DX+3uXWaaSbYbrtQ0POf4fida1jeqakmLS9kHmYSDtxEnjDckt1/66TSfs851JHPSOiQa5xRykKdUG/xmggpzvyf1lOTjWulQ0RPTQtb+p+6pdTsP5jhkvsWnEHKPkOQsbYLYjXb7a8Yc0J9IeN7UVVlEiayfMhQAhxtMfzbFIKaZN7UXNT/tNKc3C9q2N5lliRz1GxWHgLpVSRgNemHMO2AnG8XN2rSNFlR3c+Cw6qptypfTyvGQu8D/8MNDA+wxnn7YRfLvVb0zHsNcj16hvnNZMWVNzXePI2g12ub9iDAD+svrWWqWQ5NkPzH/F8eS8+PoYj9a2FHgtvGS6qdIZJd3tc9BrBZoXAbANnGE7ePRgRthpw//aPF9QA+FqVKC7wFynhYLHQueMqLcUiHN9tYMbv1sK0DbHPZNT3ZqkEqRWWFsYfcnxKid/m/K7VN40m45SlGM7CBwq1as7JDXdjRY6m96e1jwGbMt8FR99I8IZqXXdmaI/oAHBpnksl3YsuLLmjOpn4v3qIKlyKrqzN8d98dTZKpjqFPTx7CHLylHqoCuExAwezmNy/nec/36azmzl1Rwh0YLn8IFbCQenrJ+135i/w68RKDv+KPAtmVJg2ZBRQOQ3wv2lAHvns2LLA75Ov0tJtc4jNq2zHz/fNz1bPvjHqvb18WNd1C4LfleN0zyDHqbvrM8DGNIUSuRYunFvfO7sMrxjVkrOY6Dq0Lt5MIn3oNqZlqUf8O3aY20bRN8zo2SuahiC1+xWrDfDZMpyqv8ZSAsZwL2oJ2Asn2M/K+fMfjpgH7vY4ue2yv5cgKk0lg2K9ns8V9vCBAqile95ox+59gRC2mVy4p1Dh3aH3rz8fJlivmir+9gQmxyF7mxFUpgdmdhsOVS+x5H+U04j1PD8sqpTZ/di70hNQWbsUT+SqFKC3agKksAcaDE+avXbb1oLS0NXNCRMLdGXLGE36/JzO0I6Upd6k/gAsXmGW1cyX4mUOwqd9A07g0qFcQAidM1W0ut1z4TwUX2H0ZvMiU08yQYkNSmKuPfiMHy1XSG0HbpyZGKryo8EbQ8h5QaJ1Hb399fPnqiMapboBtEEBbZKuRl6X/HLPxw/G6mthmNO093UlS0GsyiJ2w9AC/ar4w1YpivF4X3xB0FT3/60z2AISJ6M5CEXlCv+7Y1vXQ8s00Oi5rj70d/GtNv9FhNFnFhV2WzUHXamsTrksH2pC386JRasytZsG1VQ5gqpIee5m5b091s0qW7Gk/0hqqfHDbv3zLQc1B4/XSGhTKnflpqq9fTVQYFy04+P8l2wmS9pPMZnZdAAsyyb8yfC+Wdej7BOSzE+dK2UstRKqPyWabzaz73MzOd8jE/fp78aNKekhj8ZFed3krViDVRYoVcxcHgRgBkjrgQI/aijlMkJZhohY9zObW7v0Sf1XbiNmqx5liH3eDxZ1LYa5vAZeml/OicN1xjK0jNzzGrwxuHnIiMHs86/InW2DxRh2XJkAekrjeanadJ5Ki+nOa16hytG10+Vu0fJPbP+U3J8iJ9KRi2do5XdnpOhdEtj8kZ9vjS5agrS7AKqhsQ/epV762JuNtcetXVLsLJqVCc72qEHuyA15LYoW/AlJRL3Lm6MtzeqelzTNCgemVDEOqPBJ86+M7H+bASRWT9csFgZiNxWDePS16IMjolLk7bDD/CbhJxbGWirCYMAmlYbf97E3Zw8T8cGbep7JqfBD2c5Uv3E50plyeqbh2urbckUKxmtTuodkYuJ/pJz/OcjWfFCUBmD85z6v1wpyIqjvWaR1Z/cw3CaBjkT+ih9wEWU0Pg6AoYgdjsOR+WAr1FU3ibXKyNXf58l0Y7ya2/jYkj4UcrV7lH6uFOFp4Z6Ve4sITsfF4sq5tUuWmCQ9vOWIm5sHo+HObu48XtUZrGQHWiWGFwKZTVpGjWc88lek9bo2HhjFCyviOSdkrFrcbMR7LGnyeryAAZOtM6uSiGE7YIKo7yHwneLiuqk/zz6letmtUOn8iCkDoBF8aktfWxjz/+tK6BUPB8u/npiRXEB+nEfLkK1m7mYZaxMK3GiPR4jXbu6R9Xnl0Be3zAow2yBeWIZJPGC+Utrdtip2LTfpuTp4pVE42WSwhg9jgOq0kUsIZOfby3Oh3xz+vm8gxwZdSqx1QIO9IlkM3SJa3k3BiAwNnJnptvcxfIx83TIWs31vtKuGH/yiLpPpjL7l7poFkipj95biFWMwplmp0GanmB7+AUMdDfe7a7vGVg+UYq/cbVUoKSy7btSJBIavPzzyDE5lDciqsvlWVB/CqJeUU0aho1yl5ESxPDaMyz3oRftnGpyRtA==| Hypothesis | A tentative explanation for one or more observations that makes predictions that can be tested by experiments or additional observations. |
| Alternative hypotheses | Any hypothesis that differs from the null hypothesis (which predicts no effect). |
Experimental Design
Types of Hypotheses
A hypothesis, as we saw in Chapter 1, is a tentative answer to the question, an expectation of what the results might be. This might at first seem counterintuitive. Science, after all, is supposed to be unbiased, so why should you expect any particular result at all? The answer is that it helps to organize the experimental setup and interpretation of the data.
Let’s consider a simple example. We design a new medicine and hypothesize that it can be used to treat headaches. This hypothesis is not just a hunch—it is based on previous observations or experiments. For example, we might observe that the chemical structure of the medicine is similar to other drugs that we already know are used to treat headaches. If we went into the experiment with no expectation at all, it would be unclear what to measure.
A hypothesis is considered tentative because we don’t know what the answer is. The answer has to wait until we conduct the experiment and look at the data. When an experiment predicts a specific effect, as in the case of the new medicine, it is typical to also state a null hypothesis, which predicts no effect. Hypotheses are never proven, but it is possible based on statistical analysis to reject a hypothesis. When a null hypothesis is rejected, the hypothesis gains support.
Sometimes, we formulate several alternative hypotheses to answer a single question. This may be the case when researchers consider different explanations of their data. Let’s say for example that we discover a protein that represses the expression of a gene. Our question might be: How does the protein repress the expression of the gene? In this case, we might come up with several models—the protein might block transcription, it might block translation, or it might interfere with the function of the protein product of the gene. Each of these models is an alternative hypothesis, one or more of which might be correct.
Question
XlXEVlInUNS3guHdNtj6cnRWCr/gJxEC9By0UQ65oh5x1MroW3WmYaoPbpHEYTKtiM4ZPdEERrP9GNENIzUCcV5E00zKOCEt26NU7ji68B1Dbsw1E7RYAOb2MvdC6EPsdQ4x64d9BotlCB558bZ6MwkC/h61XQU0x013GCgfLq8guUTBNoDPAyQjEDyEfyDqAmFRUOmLfgkdOxu75srCZ8qETOh2n8SdGpTSh5D387DxWnAP8nV1fdJN1DIiziektxD8ISeMcJuQ4/V23cwNi2CUGcWMdOCIdua1BoexA2R3hW/tQTK/K/udXMM6OWUAciDqJfGk4JNGfxIa22nQFjFR2jo9zLWgOBTLoeBpOZuCUHFpoOSZeenV4YFthjBuvZ5+BB9wn50WTa4JIntvDt26pq8XH/sHZ4r/cS3Oe2Y6JZ0gZtulMDp3+B8gDYgtEuJp7ixUj33Zu+uDsfZgXhZONH3nLVq7qtIPbFVD1O3nQGH+WA2PpSYU/HjFQQdVZXevP+2h41DTaIJKn/WHI7+MirASaoDoCefNozjFeVdIDWmm4ksXuKUpLYNszcSa9yModiFej7rgCbRysTWekh2jkCwVdKgCP3Inds+yfRhGYZYJ3XPY0DQZ/ogcAX/6axnw9bVsUzT3Cm8oKkB4inqIgQyUhwGFxidSOR22q8lSGyFpA9aHb/I5+0mUFCd++iVCREgPdRbOHr/HHzmYxCVq1Mf52J9uMGnNqUsDj8i8yRk97JCQvnK+kXBg/n1WOTCYqNQxnMxvDalJDEyoUZeywij7SO0f3m5ntXqPjntq1BiKp3CIyCaZbDsyMif/tnMHYO7fkZX2InaRLt80g88ki3k7aUG61m1pX1nJ6CtiMcObMMqDLVUV5/PSZAUdSevBbJ2x9+hOy2iAnyy+dOKXuWhjFQfKCcm7Ji7IFdvxQo0tIlZiWcrSqrKBd6j4PU44hhpGKc8tPapeuleUoKnfvvVFl+R6lkVX8eZfim2sRWw8dYSjf4nEiQHJ1GgNlB1TBdl/a7TKhvo4DJkiWlmSCqD7vy+YxJK7SmC2Topn7nSJpBTlh6esSBgxi0bdxcWC8DZ2IxlhSwjUA5P/4fLoMra+KhvIMmKEUn1WoIcFFtu652DvBylGBJr4516AWvMwuSHe3TO3GBtELqLUkNjJnshBYRD/UssdqjkdWXMXeGWlW+GD7zN420oOvOH68FfuCzBxBSGALP4l/LMSyCeg4xZ209Il18oYP9oCoQnu0RFb8DKZECV100JNG1QIzxSrywRPxNe8HwiKkmOATwZpa2quWdxM8STMHVbGoOCGjbShAwHs7shPIRBDTL6+/MOduaSYH/oX3L79QCT6YoBAK0xHJ+C8xwxKcpZBvy+IiA2mvBpY9HgIjt4ow0KNqLzg6v2sk8Gk9S5K25dl267GMczvMEBIZMHtvDGodu0/v0eACb8RHEoE+CMZu8vQ/8zC8yo/vUIG5NeQiyUOMjGD6xRfoqo3qABqxI4sFU7B7rihl70NNK90OdVUMY6qmSCa9SEI6d7V0V229hSH4vB6ruPXmUBEcqAp7NIvkqWgblTErzb4/BEWox2XuWnCJ4bq5US3TxXkex4FM0m2WH4hWIlgIAZTFK7JLXIoMWleRmebbj9vHBPK/Oh4uK9O4Gw5yuDaOj+H1hlIzhjIDK6xybXrTVT5Oe6DAJ4fim2e0kdSnK/XYsCtfrPFsEtZUGZa0x0cMZjl+nBNo8LVfmZWzNCVGBQ7iKJJe6vsvp9ZfXJuOMeQzxsdBkvBi9v0Hb+qZEUg3++G/ljZLNBrLrHjCsJAtgWpEvReHWFs27rRm37wgey0OvCYydE2+sDKs+RLY7biTMsFWRu6bQBlBKVemQxLwAtPRtoOFojqgbP6zjkbMBZIz1EN9/NHPUmpmf+v4YB4BPU3S+RmBvY36L0PFDbZNcSKglPpa8QbgAjIS9zv5NtOH98GbHOTzXOQQ2rW0Ngz9rrCBwlSV9eyNWrECopTeZnDaXfFVLsm92LBvuDGevYkzlE3GN9YgalvIOPuN+E94H3EnB2VIi/l5kSMQD/gCT1+3wWViOG3ia1cCRW5ofs1m+49XjDtI11GXsImk7owmZ6OPaBO8Tm3a4wUKhNvP9LsQ+ba6XkmLwGBjq4dEflaHhRFtVEgtn2s56PG7FOlDc3kww6bPookU8mYojgS9Lcrz1Lc532ngfo9uPEoInxjs689ysws90HM2jj43yeiNUP4d8SPHHgUgNZfFNoUV4r4W2c9XBom0rwjVn3vi6Iw2vFgR/oy/ecb+rRR3gmMVvsdl+XG+RRbd607me87O6O70voxK63DlH2FUfiroIUZMUrklvGxgwrrBH/Zz+f2hmxzg5hyw4ZQq5QouyP02g9Lt+ukVAQwWwhMjT0mY3T7t75gO/ZCLxdLYMgRBonA+RECrCy0UCMr99UhrgqiimmYheWzSiV67y8ntrSvKQdRDv6BxRPJEn5kV2iZSXoDqMWJS6eCZuFCsTmIQHmtVbZEBO3pM3nAQHJyEkbpzFbVPQXl9kMxalRx53zI758sU/I1Ij6B0yKaoZrKWw1wQjmiQMNfZT+dDDku6d9Tdh2fmq74N7CVQk6cbAB27QKKzdpUJnEyIKl9VjTM112ugtqCEp6X5I5PzL/GFHQosV4kTksuA7ikzORa74KKm7NoAnfEmj65078kJ9/5Al//tjCE0ZTQmBfSmIZQWkmgvQcGfxe9rjwF1CNkQoYPMwWU7NfUehCrRuWVRouz8f2w6dmTupuZsYgFcvGtgM/W7aR+Ks1eshyy3xamzN1NusZ1RYJGObugjV4ki73utqkD3bAicCA/IWS4Gm+cC5EM+qiM/I5tvKYr4pv/mHize/79EmI62sDKrKDEYmt9bSAvWFEP1+PEuwSVheqKJrUINlem+373ghVJUbj5CVX7QA==Question
fL9jSy+P6qFLBvTKXoA1rYWkfEZ9XteAlXhZoeALL34wKvzExmWM0+Klmi3FcbOcPETmLZczdfK6YSexYFZ84CXRtbycF3PrkBZ9NlNLKHkrPBSyleBS+9UOVj3Kj3io82J+rIfrB0Cl1jk8ED8r2o3kPqbJ4YKPyAtQDhSWNaeSgwYpnkXu4DENnOpBoylCCWzvVO/HAWmQj0rwUHf8/Nefqi8KuZTsLrAZ5oQea4J9Gw8omlwf7zqpGBiuhmbD+dbqZXunYoKdhsWsK+vDs6QwGXCvsFE3kHGrdFPPvQ79aGIJEjpxYWnOALjSsXL9XZxVidQp+NDvcErkin6ho3sliRZIHcV4PMvVfjj+AFE3RCaL/9wNf3zG6s8jwL0oSS3hm4r7J/LMowd8wwsFugskh5yQvmgCGRrqLO2xxePgQtJbhDce5k59J8aLlXHMTEJ9osnaGFqs0F1c0V6I8RAEikm1hheeNl2eiUGpCENhXicv65CGs9bYe3UEqmDy1Q9G4aF4AZgz078J5dav0b1odclXwb+I2vJH2cyIQ/0s5u/MnLW69N3VZygF9i54HBuFXcnSwwIG0ChpxtfZY81/6zYLGPa9rSt2ze/+qpYYZRPNP8l+V5HQdmYcESa43W8pYwkyJOhk1uUhXgO/x9UWtjKbvn7L8KmpRU2vSAgtK+28K1osXBwejURzkziiVetnPCgvoDMvhRakAvuxH3VY529dcnY1bErbUisjdXkSAn1BNqo05yKZNazi5npObz+kRi2ReqWUruYo8pfQvy9nc5Ksdzg/9AyzwsRNxDdKDHSgb3VFFmIFX1Ts3cie7q9vgJNxVi8ApFXLkJ5k61fKIvuELTL4hpjGd4DRofveKYlOr82urr9noqjKRzfQyw8pTpyfzEnFhHrc5xcnZWCeKMxvJ9rxuho5cBgVqcsu7pLMOSGt379587xahk+Ija2uEgZVGb5qFmsJvaQHkzmhHUH6+AUOwEnMRLKmHHDb+64G+TpeHD+6HBuxr2HI69Y8c9zMpl86l6YBlI5BhnG5GEWOcL3l2+F2gjkOGXPh8+gbi6gxx2RTPFeZn6etJqEGMbvcyP44epGvLdJWGfVsb2PBwQoyNViaEDV4TTSgtQ5+OUqSqYE8ktotDGm5VZsimLRlGKDuQMxVLfVMdyAVBlfjuDH36WOEZlO7sVUQRIAbv6Nd0KxOTW0IDXz/C/RuXf6VdQAVI3Y8qFtmufSxWxbacLsPUE5TlRzEpf4x0HdJJoDLvvMxCECdLINaVulwAHg36ihu8dtWLOoOIdvGMR/I9+fhLii6ssQQI94DbLghKvxbKplCDIUJWQ0OoMcowdndqkGZ8NxSWALELtBdWUG/7mvteiS1tY8TBUzALkvNqS0swbU8J4khzxV/g0AWnpWXjzi2WRJr1sYylTd5CXWXBk5di7gyY1EU1+deug6oQMlu4jRV1V0xx1rnBENPJ1sDx9awanqfy0bqLfTPnFd5kmbXYkKxo/yBO1u/ijqmdgQ3dqQB5WiQqUh5frZMKH3WJzxSsZ1YcJ5I3nmzbRnp2I6T4diP4xISoreUMH7c8lWpeNCIblnidLwl23Ya8mvuzsHEK+vJPX4++iGiGFi/O3QqB7CcvUHfbjJ32+wuroUp2XuaOnPk9Xynf/s6G2+SMqMgHagd4cXQGcnR60xtGcL2uceJILaNRMJ/EhZns3mYosL8RhgS23I5seeEgIz8UGy6ok2+8FACUBM7hhgNdXk4oc0tjWzkBDuDz5Wo5q5geS9JrClmY8GdMSeMtMQBcinZOeAW2ktbgpr5C8EAqLGH3Ih5E8QXy/afqrWnTZUuHXddmGsAvwvd+ywy+O6p5jzhJVelauysIQNr1WDZjh3bPx8ZIVmtPLLCSdldzvYpN0Ue+1cvG+jBdEBqQd3dDV4XDdGl5F2SjdkpRcL+4wjRLdvPGHk4hotFGNvVtrxWeDnwNG/NVmS4E7SmznIFzqYkHaeqM+BPuZHyx8N9qcPImx2wMdS5zy0fKhafodJqoJSqXJQ5TbbnpGenNsJygMKPHibs4dtP56LG+9hqxVXDO7jrzThtL7NWITuFpmRyuTDk68se02bhjsSrdM6gz1f3b/RE2xujNb1TvhKWxRarNWq11tNe3SoE7+N5cuEkxulZYaNLK9ukJYzUcPeJXBOCxqafa6vDLLtLnkBjajHNyZm+FMg6Rex/cwSnZ/y92YXFWxML+MKf3uwqteqNrzRCJNXi1T4aQD8T2gyYm9/D1Q6GWkNv+8VdpZiaOmMbZbg0tNZs4Id87YUVxeA0GspQfzkjUaVztObgMnSf42KPhK3r3Yo4+WndNxotQ8n2IPZVfvpe6+Gb1CXpcUv8T1b9ZObdnntqaYUF0ekovGmXlnr646mf+AnaBrznAfRu3bp3giK0F3DXzHZkac+FtQq3hvGjErOec9EUq33cDTE32OJN+yiWxAaLsEigV+df/9gIUvHD94le20ad8m2uYXYBjJczbndiz+a3l371mM725jDEAm/OMj7me8iIZO3O5600WzMgPXb/2S1HLoQEgNM5zYn6pbuMfuUdnvbayt9jlziyyFUbjNRSZ/wCkvyTm+UIBmj18BsR2hscnOrFG7T/ak07nIV4PyXy/3a7DmHfFWBC6RmDkUSOXAnwndVduncNl/bFQyqw3h36V6p8LZFxWmnevwOmWzqhliIcdJLfPvNkoCBSrhM=Question
tDknqeq8xKbzfrHG43kInK0QUCDTySvr6akitycqBZLory1Fwvm0dfWw0iYDML8s4TMOA5G6U3aHXP1AxBj1xj4fiByYsSVAPpD8rcPg+pLc1yzHvxgCohLOQwkZJTFmzUWmyIC6LpGEwrP6ghYxrqAh4VV7njC+yNzSaImy42atmG1jN3xOqoZmyOgjNWytFCQmFUtOmQ0qJZGBQrkdk0vOV9qPT4ofkhOpc/u8F6zS0XYMKcs2mWj7gHW84k1J9EdZKsGqHQmmt45x4oLPlBGpH6tvP+0zutyLxg4clvAgzpj0126/0E/hSJ+J4PBK9RanIBrKsTk8vCsLFsdeVcKVDqxs1i9YOaO2JMTww+AVCLY5nm9xQCP74fbMfZS8Jyi5jsq8955cNi0vHYN1IheZbQ5EyRLA2jpRb+BY+MJ00WmddNJfQS6foZaCqhkkqj5gbh8RQU+LrAwmOiJdJuYBJ58OXg00YVGOr7UmseloRv9Snb+N23QeFW6rlofZiVS8ALIdM9F42MsV0vuSoIxKBN18xFlSHPGk0SaZk/Dy8bEz/PiVyVOKgELZpRRa8vTqOF1eiYGPiIbYTFKOa5FrNebJnw+fz7rkuiNq8suyt7QBFVy74OlBD5DPKXlNAIqF+7vjHqveGT3n4ZYNYhJfTbclj4SLAx+HjoJSiYMUOtihv4rJLyCOVLbjM2272KaLU+LzEFzG6Pqsz4CqF1JtdLZXXbD120ptq+ChgJzQbDVp91MLJ+5ULlYZFENfdW7ohSKICDT9FxG9O12XkQAEKYYOp1vvadhJkkWmuPkGAYyjNiYYDi4RcuYx9hk5kKumjU3SRRCQG+HPUOoL9aApRSPYxTFpTmXV3TsmoDPv4J/Rok+XHN+aCMd16OoAt1ove0Ek7RHMg479qGtGRKViGUt9wn4kkVrzugOZjj4KXGb/lN0pCLPdYZrCmJwwzf7kLsIJfBuH3PICp4vO5IPPUhJhydatcefS3181UxGVZZkKRtlxSUp223mrTvWU9eKzRicOPjnILAZg6mT967T65rp/eYDU8++SKBIEVQSIHgkSpHHrJvI4yyqdK0fRH603EhWEHB06dZagIBCQDpD4AhPW3CaeAyraUHX2+Ef3Di6xZ0Fqc5sgqfITNR9wHCVoWOCYuT5MQHbW8J9PE7kloWQ5qw+13FtffAJMO1H2GHHfdNSYf0jrh3yM4jG3IoazgjryT8/UMRZdC7FKbOippBdLSnzvG03PLxeJrOByz7xzhd5QrdQRrbTatTEGl8Hu4OnVAhPYYsc8hRy7sGom/s2VF1gnSgF9XosxIs52tT+0BRDbmHDbGJvd9RkQfavkw/tuxME9L0/GerfW/SzpBw32NQU5CK/aIR1Xk6kNKbXfJEsbzCNUrgU0UuIrxqyJpBZLtJxGrPxE2oJRGd62X3HVBgm7n9FHYhIyiQXdeeeJ5BKNRIdvEcnh0cVYmNAhRDW4ditjXsbkI7D7cc18hMkvfoOW50POYjuvk5TSZnrMFBl1NcKVHr6Pg8nu8qchReXo7zWAamVyY+hPHLSi6889tWitbI00wqqYPhyCf6x4g4jCM2ZQmkVmIm87yruJGBqfH8ajz0zhPm6Twuiykm+b+zWAoyF3lI/qr9MCakntq2GZueSp/SA19b0uUf2MkLg6wsW01fH4/R5jk6XHEZxfCNKtMr/inX6LGZJJQe12AuRRWveHQcWsGWtqM0LQo7RjoiQ5zFNkq4DLk26a9xCRXNBgF9R+cZA6yPmDhMB+7wU/4+01yDp4UF3j9mMDMARFgsMdFTfaYoPn+EqY383hvML/N25+0yUhWIf48o0WYFtb0YZiGxISzDHieCWPXLLbGZ3bPB5lYGeKDM0uMFtYSwzjS5eTXhpkpBBRpw5VTlrUQHgcW5Uzw2cO4ChDfHzOLXLHo+UGgtDLqznCDlWeduPx2xti2P+pMzBJk/42hZaKtP/klbnH2UU4BqQhKVwPXNdQGTY9WCQ5rz9/58e8WR5OCHyNxu5PTQJrefUvEwaEcXNumXnEpBAgkliBEkDv5TDQeLQqO4DSJ5VUeU0oRvJTjlcSc4A3+tCdkPbZZVL9w648XYfO7l1VN29eWXQRS934SLMeepeQmo6lzeRl9Q8EfYyFklY26IbT32q0ERVerdM7WzYkQPklETTWkNvNC6zh8aQmD7TGtAZx1dAIyi8QZzc3LSgRe5JLiUQJeEPSGBlhYsdUsKOin/W29VyO5XOdtP7xQgrUbRoO2tXZ1ZJwszhgOd1MJbBJ3GaCcr4TS419fhVg8LKdecXaNT9W/9QmigD4ydEhnel46NlNTFBgXqRra8RRL8LDRA4K7FYxsQ2vp/fbW6qBYiDOJ5mdZ9v2yIptZ/4Mp3Os0TyobM40Ll+sp1CXOoLmUYfVPecHVj4p5Tf6TxrDQFZK2A/6T1PICo6Hs/8KRXMPQVfP3M/Ip8MZeHRdpCccsrdkINAcV/9Mxt0YArG3j0Iwog==
Question
YyQ+FDH1jWskjpmuir0LF1yJYLNX9tG2ZwSw2YXj0wvOvxLWqv/8+Lp6dEC7tc7fiPBLqCZiRZbrbd93kjQALLl+TsG1BLyecAmmJxn6+i7D6JCKZ8jcOjLMIFguYLVtLXOoEDggNmoVjijpVlPLqWvIkFt1PwX5pBd0NVwXoz292BxvodGlb0fY02r8LFdh3BhNCwTKju/b4aOJZR0AMy4p6eo2UCKmezMKEKyxB4C8nJEpfYK+UV55nVLwXPLhiNxvRmx0deNbQIM/VXZRpjUjqfrbOxKRFxx2BbVMj+JXQll+KIUlsSMEKyzf5ZIMfztHZlvQNpvz3kXxU3cCqiGCr3olYczNjkGqx3PZBpP6Pw2Q+RjAY/T0Y2pTeKVZ1Kv/Ceuwr4tBzifhdK1g8l6kNODW/l692IsRiCXBQu46jZuZpD0DtK46JCSUkHgHgTOTe2FQnMLOQ7djUIWCk3xX9d6euEJ8907XPiHQZJ5p72b57KT/g7WIpx268+gnzrNVNaYn/vQPOE0oX6GjMnieEkWb7slYbDfXYRdCC6OT7nVA8PhfDse5+G4y1oe7gDWHhBCMB+9OyeIVBSeX699HDArJbbyZPYSYlu8b7+vLEocRVmYlhPkVYTmf9c6B5ar7oAVcQPWLpSbDBVwrUxyrKroRDHFiIxh64Nco2hTDHf/kV8bPzGkP2uno7XDv5aqNANsbtLI3HfC9pLBg4C1dIOp/YS1pg6GwN8KJINk3N12qzRTVBpM6xfKMFoFdTSLtB5Tl3yWt6vyFtC2tJveD0xNrpYywaQ+BP/8bdoyWKyiFMEY6LBMfeAoQJK3IgRZ83B5Te7d7Xe6S4FteUyni/sx1VLdl/O8kLh/xqGLD3vClta/eImwh2cBj84wQ2NRHaXAMjuoIT9ZCdk64qJVnYV5BAuYVTh0U5qep0OY1CNBkPsIRSrVV5HlDk5lfksSX/jjXvSmfMoDiHbPEEFSbMffX6XXGuZcxppDXnSzsEeFbFHwimDRC38n1+gHCxeQoV1U1bxt6/Cxd/1kKCxvtQVOVSdVxjHhLU3zoxOx6cMqvvpbMWBjnIAftN6NDdTh3e7WlYBKhzhuziazgFD/h6NVBo2frbSvpdxy2HlYGWPrkSJXe4YLHcTX67NXCx2+8QZTFcJPfUpyTvD7oF8IlbynFnkhV+88K0zXlDpNO+UeqRgzPzxaMPN2wCBNcneGKlC2iO6vkz9D2YO/wAg5tvziq2I/WOtgpbJwwfsZXxVuUxs8MCGcdGCHE3XN7ltjH2jlQsNPKwtYGmpTyqGJWhnjbQEMxCmJVFjudzIcuvQmNp5JPKsYrBfZltLF6jxlaRmF7UW2i6+Fv2ciNyWFY+aNjfF0UJAOwDNrC7crPRt3kiSU4Ln9VVScOfvjcGWdQoUpZmBP7ldYv92WsIMIUyrq6Gbed9B7Hv0/UHVC9UtJRHUwguWhkfOZU+yUtuN4lurV4drAOt42iHXS6ZEhwXkSnVCV44/ddqcosfPbuboOmtjXpwEb2qxyyFo/nagVN19flvxrVYBZpShgVpuPUdg+oKUSNzygphDiZ/iwTw9hvKkmVUOemfC1JIl+d44lH2kWqD54bgDNl99juNFZz4D1X1K2RGmHnzblok6ZQ/g5GnrM+N6H9ID4EMooyGvMZ8DPfTQ9hj6T5vLDCidMaYa/d8iUo3ZQSsoxLk2oGMQod6gQ+8doSY/KfVqkIJX9mfCzXznVSVSoCn1J641Qe943Qbj8NjKDDu4WJaIcQ522Q5XH/W5ZT0dfY6PmmvYxiJwicMhIhADuC0NU8T00Q6KBT9MMbufMQveXSA+iyCTawWKrwGHfjE6yQednV51rjEg4V72U=
Question
EnyWKmRsONnNDBsbwVbVc0INFgMpGqCUwr1v9pfiMcW2/E0iLXNAvQnNqOr+mAa0Ov2o8el837EK5BLCcb6PpFpa3JzWvTOaXiUbnDFwetR0RiOTilyGopSwoKDFDQa303DR5lnfKuP4BEunKW3LndDYIx2GFh+yoD25QEiG/ZeMJXUHCD8oiswOfhAzfRouDaVDDL8sOVOVD6xBs9Y/hwfzxI603cn2Huz5Da2VFeP2zvOOL+FnRVmGJpDfiap1G0dal/cV+fmlH+dgnwpURunvaLj/a3cmHw8nnUT0C6xwEUUsTucBWIv9TCOzX6P48PO7kTSIhwbmhs7wjdTpFnzX67xrcjvUeIW6Fbq1RiK9EkyFIQbN2E+j4ThZ6nASNcTUQ8oQkxwBW5yq+Db4l3zu9E6VRN36VUFo4F/4g746OyqMFDla0c5dfGAbdml8gz8NKNDVkbmIKipGkp6CBb5YuUTmeWM9R5YMAr54Fb8Xs8Qf3eRE2I0FadhG3NA7QkHhSp55qZ7a707slUuq6k6H1vwQAIDf5dyrdCyKVIOBHoYnEdKERS0NEjN21t7A36ycDqOnJMHk7NKLIhl/bpzZtULSe1AvWCbeDRO6ysJzS/mJ0dUeVbdGOmhyg+ZkZ1Fvr0E1DFOrxWfIqUz2iu94fEv6fBP1A27bbilO5ZlFzocJ7dyHIkSB2K73LDQg+usDgxeiojlJ/zY7iSJkAXvzwNf8Td/U4EVEvnkonSmQ97ndRlMW0c2LpVgEQWFSCx2Zvt9HlPOKKUgDHWqJJgj8tdMLb3htNn15nsC/chWgF3R0bOmSiNaazLIjyvJJ1Ve6LL6yB2M8syMTg4bSuUEt3HBCV6Ptul8eZQDydyY21OYDbCREYdYLihuDS1FNXyfS3y6T1Sc6fAxySoM+p1GaXz7Ru8+C5RtkxNk3dj3sJ3pgFiGtVwwLg+Dp6j9AuYcF8qU1tXZteOWPMOJQ6T9G5Sqn02mfq1fj7K0M6Qv3QCbrLBrJpCmIBjjsQx9qMqKHF1YJnDHcs9d01DT1BRrTvup2+OeEzU0wdc30Fjq8IvZew7JsY1n5jKJHp0vdpJaNfAOtEyZmVySQklGuCteSBYTdEbtaS40KcyujiEyCDV7v+wYs+Yf+CzIQTqWIENzuE32Wgyl9rV32MAPnq2wDNHdy4aVQ1Ji1H+I5ZXjzBAuqbGVPh/QY7nVf2LlWV3O5AI5PCmwTnG4lBh8Qv/4MJuUsuVMYslva3mO3VySE/hZIqlCP1ehCpwJNjw7Hfecz4tTmosSnDLhy1DT4AR6d+GHtyJGpR5qgHqJuEZDilnhH0pvqls8nRzUN1L2aXGlXlFRGzxY7huQmoUVyMHpLWpaU0sO2J7DoBXgV5+/Kp+LM2wAQ1nrlrFwFZm1hVRXpP6CEOUz3LhqLoU5mSYkKDOj/QH9kAb9jbZDYtCtIG3G+R/XJzo++CUEOC+bZc8aHvnE14m8RZv6BUmkhq2Yl+rLz7xzXkYm0HNs106dTYgxe6nYMKwL6/iyLll6do0OLzbHv+dQOsAZrsE41I+ALQGv+CRE095hlSmMZjeWcaQ9jMu/4PdIoZzp1B0h4sj2BACiFe0Q4RtpKL6t1bpO10+JFakHtv8wQdfFTJg+DqrTl4Juc+4iYMWFM9f3EDshy5hivVdihEUcDSXW/001kX0Uk/gI3dYUi62dhIaVXRS65NjxOEW84sSL4BFIQFZC+5mntfmpeiauS7mxVr16NztMvo0UdnFK66uMZI59LH3mv8ns0vRidw7WoGbMMAcaGIFxYjm1g4j4DkHLV9oEQ6HDYBl3YoyQTckjT9KamZqm6yUfdsKBOagTNDaV4dT97WZ20NxUILsPZtBhwgYWRfGNGjhyZXnO866hfKo8VOAJ9zUL7of7lOMjmVPiJlzREn7fkBzEl9SI6rgG8KglswKxcMPXZrs4hV/ZKlzCVaswgnxy7kJEGdzjpoVY+/EBfFnAUMWXQDWLbFse0Rn+4cwKCx9wO6FmvGx1FJbyZ++UXEb19cXEwPpZ3EI/MrdivLgkPRtfLmzsQmLJKjOBaUD2sCUHQHwKxR61dTIUM2OCbCMjVMKfy4NfgBIBXZoywHilDZxgwG1IeFO2HvDzSO36sdk5b3wu6oBmR786PALKi1LKNTypRdPtP0qC5yEUlp5sC5rD2A2UxTNuSNcrZjArqIdFBjHJRQz+dJyf7iYqNPCvPyAmFk/cqzCVcqgMCB5AWe08QUehZ1RcQQenhnGASuz6B5U9gsMxlyv+zdO6+8EAzGGXGzVT3NZ6sKGs6ufQq30MTNTjj5plzuJ+A6DJE0ls8OoSNCbneCKKGYXwzJivayLyyOzVwP+Hy0ah9Elazt8P4V2jIBLqQI5GK0cz/u7+U1aooxYvpvqa82TN/1fRLXBJcXvWiichs40/1DhFV4kZklQ6cbMY/l5sT/zldSooLDSILr7wwhvJOig9UtC+7uFPr8PMTccGn5uObBF64PbsKhL5tUZ32XxQBVAO4/Onqv0xSGV6RPGMu70SVp3qAZC4T3qpoxBqCc8vJcHFtm6rGoEoVUHEJFp7y3EdVjtpKk/JG+Etfosms5qvVWfaG2FO0/7INmi02SuuppDUsCm9Apw4vmbnQYKAIfACd1beP5+Q6pea0yHg=Question
2vAnZ7ZMVYAAI/qJN9Ilv2FpDtQMiQeoHGJ6bwHUn4BxgAFSzVN0+/rgCAw0yKTj1SmfngiIxgU1javuSvUfoIU8uwRV/Uy8hZy3ReQAvhPdItp/vLqCNUJwgtzNTtGvNeQwZhE/JljaiC0EddNwksdoLMOiEFtf/tQjBAFERJKLoX6qD7550DcW3WtjirK8zsCZ3levdAyJnY0r/3pnbOy0Y/jCn3VQpd5z/8bpSjV4qj24ZW8WQbFeypyQQOTyvNyN659cGTQVd4AciSs2JrU/U9yIs7lNggi5uX/nH31SOQ1JOOeFqXztXdT/Vc6Mcv/4ZLcWSRr0JRcrgyTzFtczt/nwCiaqsDlyy1HfOfYbWXmBzZRd6Tga8UKoFfGERj1+UwjNMg7a46eYX7tzpY+Ntg8H+sPfoKaYspsAPEdC+D27emODmxiaDCrStpWPdwUz0ZHlY6ZbpWMYf4Gd5xXVAMr7vDaBDjfq8/YXQj40AY3zg8QeTA3OQQLrZngiZ9VUKMzf/siO45lFgAYoCJPAZXtKns5HPZllSLlR1Rgr/AlVQsbWDhsuvV1PQwgDwLuHoVKoEfg3twvLPJdMway8JgVYkvjcWZsWQ9sBJ03KNTpKf3sIBXK6jk3IfiG775Ml6HYLLPj9ea08XcpbK8jXEddUzpcPI8p8GttI1i4QCHgKA0FFbliEAbZacWT+R/kA6HPA6MkP27cCHG3HhH8p9f6l/ExF13aK+OmzxmLx9d1TwW3AKggON95HDI6uAQ+0lvQFN2+i24IKBXcbnYpDkXUmCevFlJ1WxPq7xkHYo3+mHmo+KxOt1p5T7DVNdPvR7588i+W2Dqba+Ddsy3yYa8D9aX7a28H5EGzf42K0JpqdBDQW3aA5ZjKfFEQg49Rbj20sZb6DMJtswqwN1B7mSXhggXHIpAQc0jDiU1nJgtqf+FVT74XQwgsm5+HzAbhrzl3C4FFZaWpw/tdPNUP+7qZAY1+mJ4PockgSHNx9CiF5txbAWA+wT5JA/HnWZKtU2Z0tVeqfgejeoWwIORA/1JVqlW1LPz4klcWfoF259dkrP5f7H2pEhJgEvNguSTtLE1DFxHqyJFlWfWwwlHRTSfbDB6Jp03Sis1CrgNmUOZFUYJJchhoXakF202nau5A8cZcU7XGtordpQIyxei+GXDRvU4Kh7+lw7uqZsdrTsSldHpUFblbUwvwWfCkRXMaVAiQ+ma7gMUTk0mqZg0LT6WW4zlKn4fYMgnYVJACr1I69knxvTe/+cmjYmYNvZC/H4StDOR/PA0D8sI6OpFzruIbSPMfhzE7b2WpLj9iJz+opu0skA/ZV2q1MVCxCk7Fkn4apnlnbll9IV/RwT1zQEES0PCmPdEbPUEaoXOA9smSKKsr0wAtEywyxe0YJaquAJ4AFkVzaaKN2X1bKMwojelZbBrex3zEUiWA6Iq35fQteikCBYVTF6aljmDiNszfPbHZMPBSEN2ZwO5GdEjJf94oRPlndCMG8lls6Ad2j1xMudUgWW10Tb59znqcp6SPJ2aKNOZ25L8jb3ABBXDAkwBWWMnbd3OGhXGhaD4avordMJZyMzIE1ojAePEE7pzEu8ImpOcnHgJcUe124Cg1Y31eSsnBKiLVNQatd1gKzyTym6s2AeBcHLP+I90wqDuHCipIi3qLOsxKNS4S/1sughJj+raPHQqOitxGzpopkT8p5MTjZ5A/Aaj0MB4HIfmSsQeX6JJmfDx3tQBFljyRp4UtBIqQbOb1yCUUHHG52zd3ucAtt58SHDo3GhdNdtDzZ4Eiqc7wkbXrzM/KLBgl55WISITtWWz6HhaWq3WJ/r4WZZnda5JBZ/Wu+epnQvcDzQWOKKEuKB/u/1aHxrz5PG0VlDfIe0KwmPyPq5ASHwGq29iUvVr1mJEQCQiUgUrgsXd/jbYsPfSfJN0VTtk1P+XDqCrgZYfqHXASHvUJ8i0PWZijkUuw6djTcbYBY978/9e6ApnxmHuMWQAqeH4UVLhSE6yYLdRubDd94406GLrrEVYEz2vqUXGOGlrKlfmAZpezniaYYMsblPMYCtRyuoZhYaYh1n8hz8AqMRaGU2aj819YqILhUfOxmRw72C0+tB1wB80ZpcZf4LPrdkzf52odBVbtr7zoAj1m6uop62172djtKGHZEW4si9wpK/441HClqK4hCisPgSLmp6dxEYt/iZMlsuaoiAb73fpzIqrmNsGNs0UxDfPV0BqHeL4LPUL8J/Qv5TIh9rXgFi9iutfui38lzorOwKXKwlb9Y2AORYcfuilVZ1QuxbgC0zGN5RZsxzVZNDli+zGhBhBVGAVnrVYYItfFLmQzRZjqwsxunyHsMcWjN0oR4dvEhYvSKU8ErQTtkks3NTq7jfJZ7ylK0LVntp5/Dn1hpm5YF09jHpANQfTQN1s8kMxmHfrZGbQ2jHZxzZ3zNIOhP7gG3vkG9oL5q9ivLkhOTsQGgk1r+dMGNXN04LtWNiujoaifdEHJZDHcFBWlAuUKoxwtEzQF0coI6bJQBycGS6ryEwRPI32iHHLvMyrqGs9GwsmCKdwPkv8aWIR7jFdqh+E4Oa/VWquJQn4ahHFDeX+ZPW+CA9wUgUYl+Vfce/9aWgLoD0eAxM29f+wSB+bOFu9qdwn2IkdBVUNA1MamvXUYuts1c7m0Yh2Zd4N28QInc5kQELCC2L4Bz1DgJSGf5FRPk4pLXemEtG15CX5WS2bYjJHMmGJr2EUejzdDZWcUmRP0h617XgsPYqpWrXXLs032SPiDyVnc5RWkQxO+8m4xsci5NWZzAreLbodTK1lTDKKuftftjmYLCYnwE4tdOdBZ3FT02lBMd+f/QyfVt5L9xQ2RUZPkuXUniV+X7d9qfdyAj0f+tmLUlqAb5OZODhusnKNN8KxT1ktefTNZ+Ce2z8d3K+4I7zscgDhm5ptsau1epdupsmrueH8eG8HTqnWubN6OZf6pvhJebtlYBioD0LlMRx7ThL1MyJdxNhOF79BoDLBeXXTBKWbHjo+/6eJqTxRyADZFk+ZGypOWUDOu6vewQnznnMORbirsxXIdZ6GLYQkTYjp1NW9pFxpO9DfRMfenzuKbCqE+gGIgIH7lh7TKosVvdsEI1WmsnGyb/huDyHdU/JUsEqB5ui2x19UXqVZdtuvqlaSXJEnOGvyUBzC8zNfHfP2vM0MPIRNZsDdESJylWi/xjnJKP3WgVQYu0EIzq/bSYj9fPY0pB7IZXQAI2O0m7hDgB8skLhzkte9XpzirBaPcZPELmxf0KNA==Question
XVUHT+K9OAoBhk+Qb1BMqzJPQtC0+3JKbr1nc85H7F8O09GdCxdWQ42TR/rLTKhyZy+V/XM593nYJFOg66Z6kHPujknUuAxzNeUt8sTpsq/jIXgtFniU5JiqcBWNbsrCIUOx9TEUDuSWSWQRUTY+rMN4yNgXVZ1r9HEEu3liTxkV0P9LHUM00VEpnsUOG27wKfKQUvGda/TjzpYObUvBpo3bwbnE6wuzUChah9Tr6Agf+pm0Wj2ze0aNNkc/jK4jXMYCIQIdLWZZesZHVcvIjPfAE/h9FEM9mMHhXX0krmNf3C8e10KidFVIyoDC997nR/4OUbAe8WaDVbYq4r7i22ZNGscEbyDE9t6Yvvh8EFGak0pJG+UGNI8kGjQRQhiqkLkSoawBMjzRzLb3RM3HyCDX6xu4FMFIt/M++/5C8E0BaJctWi5+4ikZU5a3w0Cv4vxL9RM/wE5DIA28l9gY0qM2jLEj52QXFjq7RwC/nMT3PSkiG20SsBpy4N70KGagC+4q6RaUv7HDpHMGQKQDZeBTLikrSlKfr6YDU2WA5AXzyhUDTchpPOej8i2wJfIwOAKo46837QDITmbp+MmWeJX70yRBebS7Qw8Ye+yHpcdu//PLhyPQHK4RLuyOdAAjaDEs3vPUAHjkrnwBaeoXt/+8EkQmAhHsSEmPrJSvU2s3rWRO2wzuN8jLPBVH45sB6XHDGmPjdYnP+4bq1snCPf8A/h7FJaduVm+RwGNGxRfMSHirKXBcbtoD7RMj0iIbps4vPK43YSSsZgsfbOl8XilKBADy0eFrIXY45pwAJDpFMNJHlJfAJCxkLnoi7moKxV1rQw5XeOGW2rmSLQnHEBi+y8zzCBWLBU9l14yw89bXWqyD0LTQeEwVVu1EtVKCdXI4nKoZoz+CDqEqh0rVbHFgSC7uURe1kkcAyPlODzjMcdUN29NVT0nI1DxRkk8qI+ZubgV2mLpkc671vA5ii1gjUkyVGEuDcNQdmYDNvfetnK32bxKUuOGdxZJ2kEOIAnq1uxwtNhTfs4d0JC39DYTDgReq8t0wyp+tEh0duJGocCJFOrr1o9bmQyvitTstgsXOkmH2UvxVVFnFGuqdCiEMAqFSYty1voFeqxCOCKxUG+nOG+O54ujnDqG/kcSY8wunz9QS5Og/yb/Te/BLH1tfOLoTeX+XJ/DEzGP6ZerXkH6s4pmzpDiOCkJkNw1kYazr1J2rkdtwgMcOI9DUBWKjIpSKdpw9DgKqcv0tRSOfVKaspnsvGEGHqdxocF3T6of5NqZe9ti4tyXmRzfbGmonDTGzLuqzc7ZDuo3l6yWTnUKUumk1vE3q1PtYqzJX7OsjHIA8DY/armN2MHeCLK9ytJ4AslKrilD+VGBx8YjB4CayKyAV6IB/fAwS5IrAYjd3lcucOykzDVS8+kS0pEDQ1QoFH2gAb/OXnf1yCJMk0qP9u+6dgHiKXIcttCVgMnDldbv8nh+PktHsesB2+5vbvKZd8zC1b5Bk2sx2kKZZG9UjShHHYxJtDBYFgTMV2zyqa6QjZS5RggAoE698FVYwA+q0YdO817hlV87f9GDHDTlhGZeUmy3AIpSgzcXGzq6IpC3TNYSSf2jbGeMhRHUl1AFEX8jnWd49QbVjrT+Inwjr5jNRhOcXxGQ5HCnwrXp5MrhuuNwaRZFK8EwhWD1F8PwNUI03dDRnb+sMXX/3ni9USD4JWlGku40YXxEODIOLE4DegXGXQ+Jb6Qsw6X3sf3E5XGv1Q9kXBHO5otcVJCtIAXv6tr3YFuCnpXPKYs8XRBKj033WLgGXIDrUeIQ/Vyci2xRTtiy4zw1bIJLnzVtQtcRGY4QW0/ZyzG4hLc7b2FS9cagFB+jb/ZA2qg+vv3v6BqzURBQOuTotTGsFXsh/LZZgeXHHO734OcXruSC2dR6a7inO26RTIKcDHYRnKZmabTiJaeSXjXMcxkg3wWbkQRaw0efC/Cj+EAk6