Chapter 1. Mirror Experiment Activity 30.16
Mirror Experiment Activity 30.16
The experiment described below explored the same concepts as the one described in Figure 30.16 in the textbook. Read the description of the experiment and answer the questions below the description to practice interpreting data and understanding experimental design.
Mirror Experiment activities practice skills described in the brief Experiment and Data Analysis Primers, which can be found by clicking on the “Resources” button on the upper right of your LaunchPad homepage. Certain questions in this activity draw on concepts described in the Data and Data Presentation primer. Click on the “Key Terms” buttons to see definitions of terms used in the question, and click on the “Primer Section” button to pull up a relevant section from the primer.
Experiment
Background
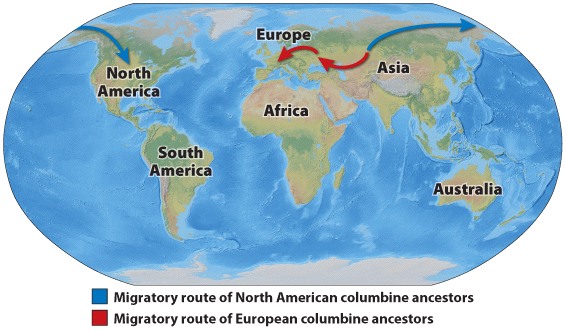
North America and Europe are each home to roughly twenty species of columbine. Hummingbirds, hawkmoths, and bumblebees are all found in North America, and pollinator shifts between these organisms have led to the formation of new columbine species on this continent – species that have evolved different flower morphologies to accommodate the tongues of pollinators. However, fewer types of pollinators exist in Europe (in fact, hummingbirds aren’t even present on this continent), and flower morphologies are similar among different European columbine species; this suggests that pollinator shifts did not play a large role in the formation of new columbine species in this region. Did pollinator shifts play any role in European columbine speciation? Could other factors – such as environment – have contributed to the formation of new columbine species in either Europe or North America?
Hypothesis
Given that the number of columbine species is (roughly) equivalent in North America and Europe – but that there is a lack of pollinator diversity in Europe – Jésus Bastida and colleagues speculated that pollinator shifts played a relatively small role in European columbine speciation. They hypothesized that “environmental shifts” played the major role in European columbine speciation: that is, columbine species primarily diversified upon encountering new habitats. In contrast, Bastida and colleagues predicted that North American columbine diversity was the result of both environmental shifts and pollinator shifts.
Experiment
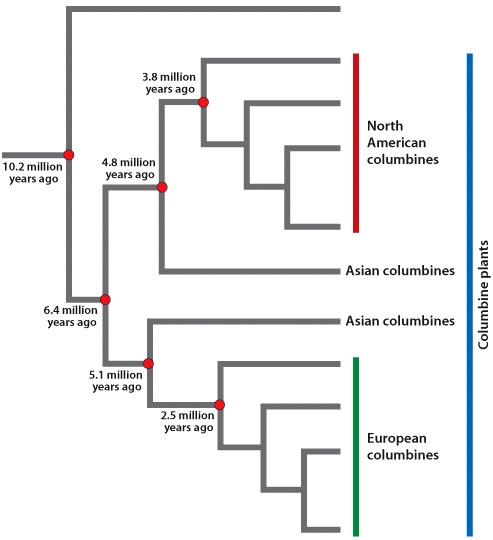
Using complex computer programs, Bastida and colleagues compared three genetic sequences found in columbines taken from Asia, North America, and Europe. Using this data, researchers constructed a new columbine phylogenetic tree that pinpointed major radiation events in the evolution of these plants (Figure 1). Scientists were also able to infer how many pollinator shifts and environmental shifts occurred in European and North American columbines, and where the earliest columbine ancestor originated.
Results
Bastida and colleagues determined that more pollinator shifts occurred in the ancestors of North American columbines than of European columbines. However, the ancestors of European columbines experienced more environmental shifts. Thus, pollinator shifts played a large role in North American columbine speciation, and a smaller role in the diversification of European columbines.
Source
Bastida, J. M., et al. 2010. Extended phylogeny of Aquilegia: the biogeographical and ecological patterns of two simultaneous but contrasting radiations. Plant Syst. Evol. 284: 171-185.
Question
Using an approach similar to that outlined in Fig. 30.16, Bastida and colleagues were able to predict how many pollinator and environmental shifts occurred in European and North American columbine lineages. They obtained data similar to that below. Which of the following statements is true of this data?
Question
What could Bastida and colleagues have concluded from the pollinator and environmental shift data in the table below?
Question
THaUsGue5frD4FhEU7TocbtojsJYQ6NnzxLqp03tl9S6JaLktOsYeWj0VKpbxbl3NXtWNkNrbD+bTBZT/j2ltg7Hw52pLbXh2h5jn3E6EmhLj983OaHOa64emftwXY6HSiSHbxjoyx0Q/vy7aKDl5ujPy/f8qpgEUAyccQrYvHv6RlxNLC6Pbkwv588aBKAk6E5VG26LJRzUfChB9UKzqlcRa/pqnVhQ2LyBqNi0b+LTXVZW6oLCXHclOW9NXUUTj1VCTNO23Ineqrq+itZlx1Qseen9ET85SCvQ4fpSggm1DRd3PVIf9WfzqosD+BdOs/AabPtL4FgD1xrSS9M6xQ5Ivfet/kpelkSOCGqI6oOeJk0z9bWmx8E7DKmQExkK6bahXXxG9WZdVP8uqSgUVUii4AeV2NUri9pd/2gaXgL4h5AeFjiUVnGIOQjKt4oftPAOPt1ru/pz1s6eGp5YJakNC/dd+rnmBx6UVoHM8TWWobjssJU3hibgxfa+N+rvhubA9YhCEP12nyMFGTyQS1lx79miI4pHWOE0ew2ISH1jCvuQYRMMpK0d/cTfaolZn85HHIRD/0/VZ1x7WnFDOJNQeMc6KacCdWhbZEM9U994yIez2NjhCJ0RCvqhIzL0pNlxIKg6leMM4FdJumWYKr1VCVdhAgsy9jqOFapAUYiQcgMLbtb8YCsE+6wJ8ul4zWCv83Sp/9udu4N1Ngsqkx7aANZYofps+kNbQVLtwp9idatCTsUHxv8VWWMfOREC0+2ARe+r9puvudlU2Jr8Hxpa8O4Z/il5xdY9s59Mvl6d2F/EcWKhZsYkzxpyzCG//3yov48szpUPJL5qmdh5tJ4U0gp4R7w4GgIfZ3l1K+kPdXeuYx1PaTZKXbigtrFudk4nKVdKCPtFyTfUtQI5rphdG+Z+aMz+QX/DKAssZ+yZI0eOm2SuHxUkyii0w6AIwSt+dY9pM9SbxylO70n/NIHX9JWDT7TXAyub9rdx3auFCancyU3+E1Hva6zL0HJnMcPLT6JwWkHQIqdk2vx2V00hMGcrkhaT+dWp+K9sth+43LH3+P0gsMDRNx1iScmP6vmCfvZjNa01AJ3oWWf3oiQ0nTwt86Pu1OUCt4qpfL9519GraiUDsh/UL0VNMU12WLLQGOivcNWh+GRVccnyQo2NQVe2SUtE6KvRQ2Dbsb1B8WPEitTBmKqqk867CWgMwSJht3wEUbR+0AFq/ZjXuqEo9NyloBMcKjwx0qGN4Xv4bsk56ar0UOU+gAsz9FVu0gTZt142T/+zW70Z13HYElk6VGbVg9jJOObu+9IqdT2RY+FNhCq+v0mY6YL3jEx2a4ZGwm5nqiIOo9DwGpEn047ISQQT4DCCnFWm+UcNlYB2HvUZpWDu1cU4Qasdopj3bI6ekcCHbn+IJBO1OHyARAqfoHn9tcdcNM+wxeIwNAVQN2DFRw6PtJeLJbJN3/KkNUkHVgtH/RLiRMItW8dVNSElqpKYUekxk/eR3uuJxiwJ2ZU9m8iJr/yia1jL05AXFJkN/qEPC/IdN//+4u8fADagzmiwlBrGY15/e53k+8f80mhBBOTK63hWh9szZHOHIwzZa4DrN2OwrDZJQ/ZXu8su2ePWBDuhgWhWj6zf1EVqJ6cgaS63OzCpxsEQRJ4n0mGO0u7zgK/DnWAzlEfoGUsHePNEMJDXq4XVpmDnqtzaKQehHGm/kiH0X+bJjK4NUnYCLEm/qy91DT/3LTr/UUGX5B/JCDc0yAqcWYiCMkgvP9GBgSwLuSvG6SqbWukOTyZmunkRUVyo7l7nwazlkrawDvcRA+vgWHYZ8qWtMPk5rE3X3hRE+Izzb4DM9U0ylBvjTQIMIwO1DANh4LwAYR9VI0JQDxfBVv/3h6coyjXbBuO97KB5qebhgDUh3DDpUlapXXmYFprR1uWv2qAe9Nqa9hIcMVH6isLzx4szx71G2SWuND4cJC/3bDoUUDP+iEu+/Nl1Wwacv5TJkF4d4v8ftSBLgTAtA4311tadYXu5r7LSdeJ7arV19mYyzccpwkkyCZ3V1hPvFHAfEkIaLg1mS8j+pHSvlNI6t3l6Hso6v57ftQ+bA7Hm0ldA6yRgvhXdUOpuhk6vh+6l07rMQToEFPwsB0xYOGoc8k8slTvDZlP5+uEFXcJ+dCjL4DkegRFL8FYLz4OYk837QBJgeoBVjoST1Z33splhaZOZqbLrLUKmYytDHSykN7mYt8KNAuUWBlm/xcB7/lzANuEPGZdMoDik82j2Zgpn5PizhTDgYIlsaLJfoQxCz3q64X9uKH0fQEpAl4iukPy3AVSGSyZunWna1a3g1pHi1WihlQFh8hMdqkiJ3uT5G66x61+1Xiw///mxm/+ugIAF1/7aObhkVc+5bTfyHm1Zag2uRaa/PYtQ1CIHOb5Y6MdP7Mclxhas6pynYYeZrRtXO/p0jG7afHmJuxPD73pW44gAcV4wIO74DqSWSFTD/Ei+UHjpSoLEiFeQRQZqxyJAN0UdhTFdwzz7T4ChEDjZ7W6RBG50y/50KQC6TJC6gx6VzcfhrZfRaAfe6Q1I6/iBd+oWC9IQPWUT4uUKSvlBM2j43TcqGAiZfPVFxIcVW3qc7xQhKnKLGaGH8Yk3NjOAAXJbEBGUrf9bUsz4clhDHqu+QOFEFm/+EdaW3Yg29ZZVb42ZxgzniNAcxuO8bJGtMKJAuFtBMgUKC3sbYXiyIqLrm5TOTtGU1tpJW4r534AFHxQAYR/f9OaY6V5OXSSRErXqZUmmEhomvvfPGJuBT6CmNaz9WQyTlB32c0cF//B3qmCujWAlK5LON9TcjkAbYouAVdTnNgZNIGk1MUl1e0EP8x6/9zg2JdushBvj5x4bx0UYJJod/vYf79zjBfwoAkR+bRnwhYwHINFv/lrxKl0jqNs5VnHrgH/LPdlILW9UXH5BGWMIssKHr2qPoLeNcnO+R2z3jREethTST2Q/cw8Axs0C4eW8ywVV/+WbOIkRkUl5eVj5ciItMKcE134fm3QjIF3W3Jmmi0j33V3aFuCXm+8l9yIOhAoW8NT1147cw67Gs0qTrUE7OzQadKe0vOV6XJaG+M4EiOIcT/O36Rl1TVsrHjCVo+FisuL+vA4pWu0ejpXfvYCewKFmEDczizA1CiMYiAiZJYLMZ1oJM55DEzEC2eyRhj40BeM0acIT+5lK0M5N5v6S89s49F7Pzks4oSYONZJVbNkHxedH7w==Data and Data Presentation
Graphing Data
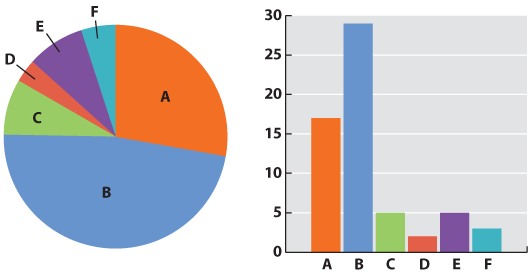
Now we can be confident that our numbers are reliable. The next challenge is to present the data. Typically we do this with a graph. Different kinds of data lend themselves to different kinds of graphs. Our mammal species data is discrete—we have clear categories: A, B, C, D, E, and F. For discrete data, either a pie chart or a bar graph would be appropriate. A pie chart divides a circle into “cake slices,” each representing the proportion of the total contributed by a particular category. In our trapping study, we have a total of 61 animals, so the slice representing species A will make an angle at the center of the pie of 17/61 x 360 = 100°. A bar graph represents the frequency of each species as a column whose height is proportional to frequency.
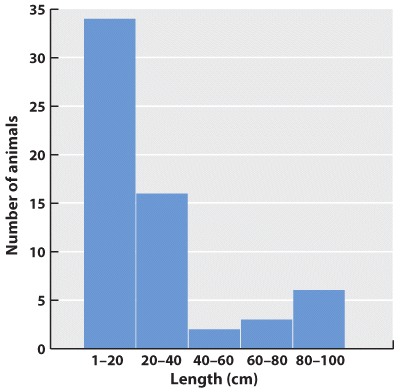
What about continuous data? Imagine that the data we collected is the body lengths of the mammals we trapped. In this case, we might choose a histogram, which looks similar to a bar chart; only here we have to impose our own categories on a continuum of data. Because they were discrete categories—different species—the columns in the bar graph may have gaps between them. In the histogram, by contrast, there are no gaps between the columns because the end of one range (1–20cm) is continuous with the beginning of the next (20–40cm).
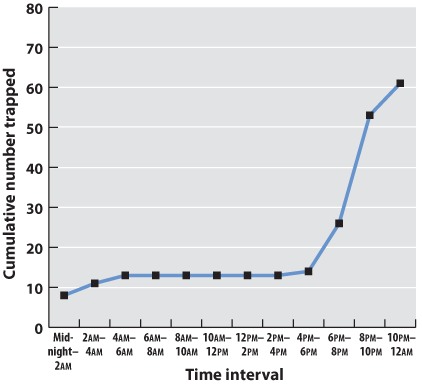
Often we are plotting two variables against each other. If, for example, we record the time of day that each mammal is trapped, we can plot the total number of mammals trapped over the course of the 24-hour period.
| Midnight–2am | 2am–4am | 4am–6am | 6am–8am | 8am–10am | 10am–12am | 12am–2pm | 2pm–4pm | 4pm–6pm | 6pm–8pm | 8pm–10pm | 10pm–midnight | |
| Number trapped | 8 | 3 | 2 | 0 | 0 | 0 | 0 | 0 | 1 | 22 | 17 | 8 |
| Cumulative number | 8 | 11 | 13 | 13 | 13 | 13 | 13 | 13 | 14 | 36 | 53 | 61 |
Often one variable is independent—time, for example, will elapse regardless of the mammal count. We plot this on the x-axis, the horizontal axis of the graph. The dependent variable—the values that vary as a function of the independent variable (in this case, time of day)—is plotted on the y-axis, the vertical axis of the graph. If there is reason to believe that consecutive measurements are related to each other, points can be connected to each other by a line. Plotting our data on a graph using the values of the independent and dependent variables as coordinates gives us a line graph. This is a good way to identify trends and patterns in data. Here we can see that the mammals in our forest plot tend to be inactive (and therefore unlikely to be trapped) during daylight hours.
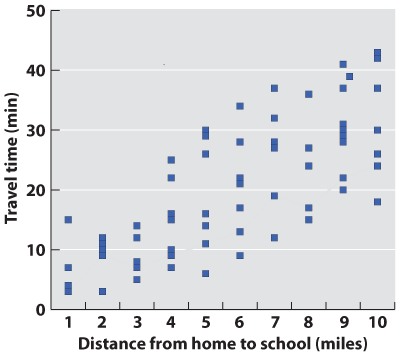
In science, data are typically presented as a scatterplot, in which points are specified by their (x,y) coordinates. Points are not joined to each other by lines unless there are specified connections among them. Here, plotted in a way similar to the line graph (with the independent variable on the x-axis) is a scatterplot showing the time taken to drive from home to campus for a large number of students. The independent variable is the distance traveled; the dependent variable is travel time because the distances are fixed but travel times vary. Overall, there is a positive correlation between travel time and distance (the further you live from campus, the longer, on average, it will take you to get there), but there is plenty of variation as well. Look at the eight points representing the eight students who live five miles from campus. The variation we see in travel time (from 6 minutes to 30 minutes) is a reflection of differences in driving speed, traffic conditions, and route.
What if there are more than two variables? Three-dimensional plots can be informative (but can also cause the reader headaches). A popular modern solution to this problem is a so-called temperature plot, in which the third dimension is represented in two dimensions through color: red (hot) for a strong effect in the third dimension and blue (cool) for a weak effect.
Graphs are the mainstay of scientific presentation, but you will see many other ways of presenting data in your textbook. For example, studies showing how different genes interact with each other in the course of development are often illustrated using network diagrams that give the reader a direct sense of the “connectedness” of a particular gene (or node). Evolutionary trees reveal the branching pattern of evolution with species that are closely related having a more recent common ancestor than those that are more distantly related.
Methods of presenting data in science are not limited, even in textbooks, by standard approaches. The popular press has developed many graphics-intense ways of presenting data. Think of an electoral map after an election. You can view information on a number of levels: whether the state is red or blue, the name of the election winner, the size of his or her majority, and so on. Scientists are learning that they too can package information in ways that are simultaneously informative and attractive.
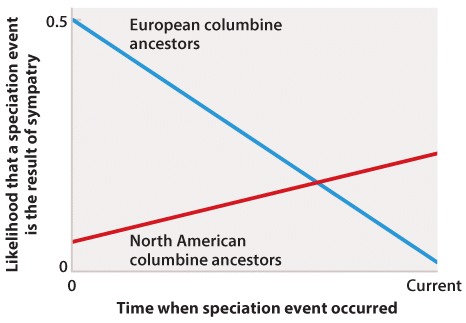
Question
t3YgXlakTIz1iT54V2cMWhh8I9+wbSNG9ELVa64U5IkUoGgcNY9klT0Qd2gsKbRt5ttHBS5n1ZKdg2b8mIc7s25wd3izfr2A5A7VkVRV2ASFXCDc9tRR9FT4GzOrNilr0d7YlJFQxZFSFLzsJaB0TKwLjL7w6oJ7DfdjbJT58ZCdsVnrXkXQSdK/j+OiEL4d0N4HiN1K/jRkUBknRlPG2cQzLEZ2gHxHy+9WceoozQNGbWl1e7WV+84l36LFoBkGuTpteD7S07xsMqFwoBdtZdWMDqU9Qp+4A4K1gGMR1ZHJx1DfYDwtIN8CwYbxI6fQY65ZsyKiwAbWT+P98v1RomicH1PDQBEAuNerJHpIWXvJjgMefKQ6JHaDwbtWmXexl8CS3oI2SvdgGXL7xA7xdPnJXZFiZGi83Ox6M7gVfQc0zMT/0lSLmufjuBgOjUxU9oE3wgFjDoskMirkZzef3f11GcrmX1/6xjHOIHi7gT7HoEWheZHGZ+sGT3sjRVTEqcYjCoXuUUSje7EGuJnruH8EIh1FOKUbCCjUKxGjjBTNvyJ261b33lxIsFG16sLp68A5VA0yOmIE8BjLniIOXLKUJ9XoHIh+jVl5ZZJsJQcOvNEcBiXev4fttbum/iGiXE8CyFsVxQiF6EJ+IwCxO2eARuhdtP6NAyZf2sqgNFUEIk9smN3qb+7fDzhMQ+foYgjL5HNEcq7RizPr0FbSv6+0NCbXRWIoWYydlYXoGaw9J6u8jlGJv/sUmWxvv9G4Wh6NaJ5ZAL2Fx1DuzVpURBSQNQRh7kPhixqMB6pygLDe1AWaFwke0OPNuKN5xBVGYQbtD/Vt502GmOr2rK2ZX7hfdZa7yZpHNqGX+aAXCunvbf/TvH1S90UbmxoaiUaDIc4GunM7sS2U9sAjl2NnK9WbfV+qQwsKqCz/PWErNIuJNnvVtSFk6nO8/3AgquvzIoFD2o+QmcFPkUkPSb+lifAA17xRRL3WG+V7D7ECMF4FHUmGdKHNY+nWSP/d+vKZiYP2OCgIvYAUjKLaK3yOTVfDR/v80QBkhSxC6+9CoMXSr+GD/nEN2AcT0X7buU3iLW2J89xTSrSrNfTK3nfz1bX/m6R14JHIgiX2NLxG6JouBX4Au8uFhM1a643oDjQg5KiIcgColuAeNcaLN0It5lj/3LXFoBBp1/C2CNF+fEiJYfQuAGLS7qwFPHTCt5Sa+yN29Bxn/ZajLP5azAKDAd3RFdGefiQ8TcRSnEsHec7FdmRrPrg2KtqOyPLstb09sdnh40Vs5q+JxppOeCAAe6VrKtAk5L4UM9lUIESyfoVvFWu9Awn1eUFn8994eaz6Xi3QnOYaQlLcW4/g0E+Q9kRMuJgNrJAaDXzuGa+S10thogZuBdtluj8pzo+c3c0PXXY0KOEc65c2bH1rgt2dwPOexC3zdou0rA/1x0taJV+MnnL3dfqABXHb3OXvg4qC+dLgqKNv6wreB/KTLUFHlfCKU++qMYsrCXkOeOI7SOZAQCqd8TgjKQrePzd4ZT9qXbLebeXRw9l5n5sGu47vI5vvVm2gus3bl1aJNdgQxu8kLh39zD1cX8eLuosryCgEqqtrNozF2yh0vahtaXJV0TQKpUVJLAU+bVZ0rIsCBteDyzbhKNlVt2irmESaz5zBdoeRmKJ8macmSNFVCkdPlf4DG/xKg5PuBP48KzAo5txAOxUzRuRA2O5AGjcBcBpC4HqaQ/rhbSHUcLY14Si9UvUeE427L/i5myTVfxZU7hwMhkjbgDg6ruO/rsL/DHIKIGouusCdUNtMW5jrVIt0KYFywpvxTB9s02mWIXNo5xyUghG+MgLqrKKOGQGcuKHOsMdwVE8MQziTqXbsx81BHKq4OincaErQ6PlT/8n7rm/Q+zz20eBGVz1uhPYyzoxE9T/xl+I6JDyM0zNFI5UygT54bbh4rRGz7Ib10LpYbeYLYP+zbUhoPL1Pz4xFeXRgtqR7mpTG4ZhP9lGR18/GaZFiJnHRV5FaV3SiccsvRhOpdzsVHUWfdEPk8BrzpITbJxOsMIJvU3v/SaHUOl6x4PqY6J2yNza8u/JPQUh0Ln/96vm6g9ecYt8Y0x7BdZnuhhwL1ApcI52MWT6hN/aNs9lSzdG9SJtLEVi4R/itUOJKcrHE94Vt1OnGtVtZlV6IsJ6lKbKerLF0oD5bOjGN5MrOs0kUxBiIqsuXpzFcd3vWLBOXsQYqtQmYsqmNmIfd1GyszeDQoI7vQ47fI+AlJqJNWqdhgdZBYQraA6uNXSNIh/g26LPffexomhkgg8ZPf2fxmt5ZdGGuVjKDUvf7+YzPihzaWyzmI1tL6gjHdeRse5hVn+fiTSfLZMw12i7usXuKyJP91QD/ngsNZP+jazIrLavX4Ci63cm0bz9wkWyGPK9A/XbEcPHbpS81+RcH7FmqRQqIZh0DlLacY8r8P5x6K+w5Sw7YDqh+98UNf/fPGykiZTnNmNt30upQdT5kvwtCjVO/Mt3vSKZHl9SClqbIal4=Question
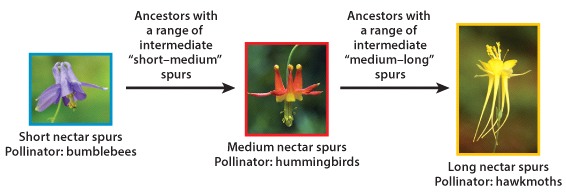
As you have learned (Figure 30.16), bumblebees, hummingbirds, and hawkmoths all pollinate columbines. Respectively, these organisms have tongues that are short, medium, and long in length. In response to their pollination by different organisms, columbine species have evolved flowers of different sizes. Columbines pollinated by bumblebees have short nectar spurs, whereas columbines pollinated by hawkmoths have long nectar spurs and columbines pollinated by hummingbirds have medium nectar spurs. It is possible that ancestral columbine species had nectar spurs with intermediate lengths, or short-medium spurs (with a range of sizes in between that of modern-day short and medium columbine nectar spurs) and medium-long spurs (with a range of sizes in between that of modern-day medium and long columbine nectar spurs), as depicted in the figure below.
Question
/7ss+xAGlrb3odyapcuvNCXReULphcVSaEGjUIN+0PhlEnjKR270K3mUkmLs67INYLgz5DBw7rNlMBGA99gNcKbxVj8/awAteP/gdAuGyKRSuaoDQO9tzGWguZ6pFe0AZp+D1ME1Yuc2IISyuLZWt6VLQaTUQ1unAhhPViqiegv/uo51Jpg9i+n9IHogRL1fiC4qc62OklqIX4WvyjnZjjueXtZzkADqCMYrYEXjqCys5RFrAHWPe8uUgNQPmB1D6sXIzMTYBmmJe73VdKAnoWX3yyPes5MEFQabSveOY6hzDuqqEGCW9sxW2px/UpHo0MzEo61uYUc1Qx0t6MpI2YdlGIz3cVd2oWgWSRKC0eO/vjl3VUTaqSWghawkjXxWSNZ+UNKsAx2Gk4GXA+8jUFN1JwC05EayqB9k/4J8CrExsFBRYf1oJm1K9hiEjQBZpzG2d3ymRT0rlP8JJy0JiEOSKxGE+LSXJv3Afns/sPU3P+DcrqiRHnyeF0MNa/01x5FcHemcAbCYS0i93Nwu/RlMXlRPsORZUTHgnYtMX3uN3MbgnpHuazB0FMU35YPgt260JIR34mOulvE5bPWGowo9svCZsjdDkg3PLuH26n/y+HfAxpYLy0hGus0Kn1jxHfdjswj/8RwNVSoN5Pafkr54hX9noWBo59HTt3TsKA2xts3H0Mhf26s6WeRnPwyETNTGPrpwQM7SkhrUzvxvg3tgmuzgTLv+4u9CCkkGj8sidUTgv9JLpuP4/eMsD1Pb3/esQicp+bOhpiXAmBBmFkVsnNix9ZvupJAnW2PCpxaLILiuWvQknQmkgJS+zx1WT87DZ1m/mSTTXR2i94jJHWrTn+v0DR9gRoPNPAK8WEP06VIvtaWQ55RadQ8gn92ksj+GdIKyKCCU8XtU8LoWXf2IC4w3yYtrPZb8ExjU+5Zfquvb1n1gaK82DrnfRPB9YE6EQS1m2MHPjdCo9HC9Nlg1uvVzde3dMsR+yDLaEnNdVuyfYKTVosIfKrqEtHlCAKjxJCKtoUrtBjI9DpnO7PWREUR3Sl27iAQrHAlMOYqbOpJxvq4Q1NTDMcB4a95idJtLEDT6f0yYkAQzAdAt7ETeL5bgWs2uT5cHJFl11PpoknnwOTNZZCc+auOg1DQpd8667hK1qNp2tVq0PFkZ+2wKwYcs2pIjVV7ZTEP974+p047D4Ctw7omWfEcZHgqrLQIQM8/VpG0BQwIw6s2KKFxOkT0GS26t6xtCI2odgwam7TXn1RjDxlGlmFlsZPV3VY2R1XLiaFmmKeu8Lq0AlGxlk34uNIXQk+bGXndOsRIhhZETF0JII7nPFn7gku8Yt+qHXtEvAZMvEeAf664uXAEyL+ujlA1NQnIfI1VsPNNz3LiPAD5Z8FRF1TDsmkTKXNQIUBul7yrDItCAXBSDVmZA3pJNUqUNFRMWuup1JHd7LKDjNoLMjG81GKfPicKxhiBw/AZhTPJvKWEpxo1pymS6wapCr38agHtcWW6vHqPyHfNKde67rncadmqJdH/8kUf4w1utW0WDafQURTQgalcfklbHYcMgVgTkw9J7VeIEyx0EV1saorgBbL/P74XRuT0BBMqe3lXnolNI9KPC91UYHhBL8CH1znLa10cqqb3QTfN2d7w4diQU2cjJjGEarEvI2GWIXzc7y7fAlbyEHyqNiWt2DHILfmWpLY5V6FJ4zEdiQy/PLTvyzPWM09JHTii7dKCMI0tg1uefFyEk4bmXWALTDfyooiJWk+COr0RQXPICZDlQScJ9BjCao+7E/1lwdVhYDU2ah/dCjEqhYK9Y7tIR+eZIJy0dmjARY7NNLdo8q5fsZ2Ksa+R10FHo1BDdm7z0h6n+94UyjsZWd4E9W1sv5ao94O+JDAY3qNlngkxo7oDM4PuC6iImnyKYPv+EHdatrBK+93jZbs9MHBz5c8Z9vwPp711iEUGXsQbNjkvuH0VO7RjTk30Wku6Ybdpa+ssnhtFSjlLRX8enbeC7uE0aOsBRdLG4Ov0N5vihAxOh775KEap9cbHwNZb/JMUKXHl7pF2LNQO3bfmhIiKjA9iYo+cjPJjIuZlv1UWtUaUTSPKtEpe+vyozn8cWoDIR2+wDSHmevI2aXIOGN61nciJ/P0cmsmaWtgzMGul3nKVMz3K364J3e7mF3pVHvheJ+xwqbdWdJ+7UhjpsjtNOT+al19Ng6d1Kz7EgrWH7FFf9YoSpdN530uwcvx5B9//FU3555TMFaqgbIEag5whEVF+KtpidNHg8ohtZnaRgJqlP6e0FElV7vyhUteLj3vZBMlHYoL2OpcMNOKJXvOaSWkIEeTiaC8RQMN7o1Cs+dukjpSkd4fzP9vA0vZt1Is1QokgNjKYbftNMuTX9Wd7iOzIeeiQIqYkQaT2hD/moGpW5oV/k+7jtSfY3PAaN6VkVawOBFOljPj6B5W0dg7M2XHMq481IMl/idnUj1IhQXA6HNm2ndv3i3lHCRa/VMliA3MwLBNhdnYstQXqYu+jAl46CPsGmp60czRolFeQMlcT43yNBytJt/AobJyJy1lSxcnRnAJF5MQLVtv4XexoHkiBTu40ESJsRHaghv5S6zH5DtiLMmvgcUbC8Zp8BXAOs6a5eNWMXiU56yc6Qz8QJRB+yL8CvGsk1C4fGwi502lShH6djFW1GJ4lDGP66x5r+8u2R9RBvxy4ZALG2z6cxTS/VBETU94BeQUdgaVItK3YqHQwY/MoK4M2wL5FUj7x10APUJQGRRbd82+jqt853GwtEj1FJcTiRIBeNy1/3czsXRg2RT6YZEZ2syWv06HEkRHjiHLDW9ntU1P3BZpWgB05DStUfneaB+9504JbEtpbn3hOJ5Y0YQVRMQIeIA2bNLblfYW8lEX90csUnfQBFQS6pnEvCO97XdX4Oi3r+UmyxqhUdzdrI/j623/32MxndpGCUDGkB8/2fpD1MFYz742Ae52+mdFpIYelmqwfXQvxe1/2nJprcnP6IyK4n67a7008yfzRDJeDwbAZijlWb6AocEFCCnZAD+abJf9LAu3y5dLFSvGpPDXOj0KTn6bdGz8UIVLkcUdcZy3iDEi+J6caAuwLblHzkKW4VeDhvLkRG7fJL2PUcXqNcvxBUMTw4oxL1gUDsfZO5nEbO40u6hp+Dcl2BbavqYLooAqqqN5XHJaN1OwwXvfIC7tjwludgb71/BSMxCsc7d9fP5WZqjYEBtLM/vOa5The7PaMqBF4xm92mqeXdTWJJIqGyclbiezfBmAhIoLjZFprg56YnMuBC9M+6OdNj9Tp+/+H45DcVjPJZWHt0zwncJLKkSwxLCwty1UiZ0cnn6gHbq6DmTVJw+b01A2YQdUr//HbKS0Pas0y50BsfaW701RUE8o46PMoF1BkF7Cy0qnRu8sH927nBK53We5LOWEYlwIwrv8Mt9gOE5CURDpxAIfDB3vzQ3fEbMglSi8VivpVvUCRiET+oOIwkqV+uoMQykqwH291KW3BSI3la457LD/C/Upt6OxHKfha0chVEFDZ/VMxMNW4m/Vr4UmZ1SdcsUc8Yuommne6jrA==Question
Z0iV7wpsjPqAEnZF3djEC6Hhs2qV0BRNHOKQEMNLZgT/kBqfknG0+3YuLsDmX9PCNe9U3IkbZOe2KFq8WdctxLFUR5aGBS5FflIlzW11RwECFkQDlkhAhC0nEM6vNxFLvGrlBw/DGNEqoY4BgqdwtsxPzKG0sNQ7X07cgjztV1mt+RcxuAuAomZUM1/7opJi6pCSuYr6x3BCXQ9KTYJLg+i1K/D8NDz1PISC5TQDwCKfd1l2dnfuioQChGCMk/mUFD4G6lyVA8VgmMWbZvpMLAWBEslpEFixgoPRYxnGS5cjRqIiQQIpMfCW7WCutl4in/nHsoq161zuYBe4AMRJaCuItLX/V3cBDF5rjI9YGdwWpj8BaDoMubxGKUsRfjfYnFlB/JpCXD3XoJwcyBPC/f3RMm+6QVeGJBVsDGpJb/FHXSFhXeiMisoxB5AK2YOVyi3YKvNKVGYsUML/Sw5zL60V5Cj4y+ynkLncIh3qlImuX8PlDCh+/pAM1fF1HNVpAdm+jI0Mv8MDt+FVoCiZZC5ggtnmkRCAc9FUcbFVWVamiYOrSR0H3qMVxTeA+pROeO370VMEgTWecmXvyEKZootg5YlEz4FZ/HsNSUNPXN8bsh0sxvBNvExDeHfzfSV+8BUREXYTeCa8dTSPonC6J4aJaVhNsGNS4CfDjCtlAE3LMTYNSmXrolgDX5OQ7zjPf0UX9BX7xJ+Evh5Wje3o1SHHKyU/jGN3RdKz8rlTtuJiQW66ym9JDh9M6C4IaJqWWFjMoXr15ndPaK0DJ/PFY9EZ91CqHA85U5eO/00JksNQDJ0uwKnQVPdpOVPlgzN0opypcfDGFngrGx3v/9m73XJrTA79Ju2uKdSiI5BhIPSX8j5WpRx8I9lAaAKDCw9/T4VGKq0slh1G6PxbvAmAe2XswG3I1K37yFZqsrWrCrv4hu475kBcjUfShwPAdL2e2n1nFLsEzpdTxset9wWrk1SSayjHWilEJojBh12fYI1ridhXeJlyNdT8Cn5Q36yPw2d1WnjaY/VuJZrpN6YdySSKKDk++Niw7RiNCwnbA6spbjoLQF3GpN4qIdVPOr73squ10gYbLSMkwegmmgVI52cY3oQx9jZUAKc/TcXIc2/O7l95ni86JpyaicxEcgIi1U/avvZe1LAbU3ab7ncb/nxNXx0bk5EXGXLnmjLYkK4XMJM14yE7qCxP1Ok6F7cd2OhvRt716yK5FBM/s6DFtLPH03AOA0xLQR26mhcZTzEMsqzIbYhga4rylmkxVnVhMrhTIHLu7+qnAoNCtPYYgovVzWirw1+HryYSxAoOy24MAleryzcWLVBUUOns1RXx67UJfXtBF5GpayH6hmsvg/Fp3t4Ye+2DIpX5Oa+VpCbf10aWVd25EK9lj9eHx6A12I49NRNWokwbI6xJJahDfELvkj1gVBLIeLIH81b0+9nFU6tDwC4s7vIIa7AD9mOPDBkquYzN2/B8nnH09LQ11laLyCAmBjWxdnPwJbrjk5cIyFBoR+xpu6hPyGYD9MowOKMUobvzTeWdNtf87j0xt/Tq6lYmyf9dNMHx244k/+S1nNqP4hOZKTQ4Em43AqAm5ig/UXw4H3dyy1T7AfkjxQtpRCoH2Uove/408IQ9hxew7bnx6r9Wy4QzRhpi9nsXcr4sfEDo6EZUlBOJRRy6zjh0iTN79v+m0bUPNkSpZ8/7jKYYw5a1nVTSP0iKbviFggDOKImMkl4ngSnE73HFc3j5YWH7fPR6maZi/x/7T3PwSs/8Gx7NcS7d9XiNxMuAu6VH/+DcSOaYbkcD8d5SqAtevUSFOjOCXGcoZhOLZwMGD6MVPnfIPrV4/grIkv7uQc74lQJ4Ja3sXBEsZK2lfyMbn5fga7aJw62uVCrLRNS8dEaVX5AfAY+fD7lytf9+lVdhX3vsKED5fF/aaXmSDfe40Sqn14iiCBPqTTmxyjDYUTwcN2m8K0AvM0W0Q/52agqbf7hQkLRm0VIoLfmh3sHSAMtQoAH+TRRCN8yXZgIsR7Hsn61qGn7+ug0XOhID1OWE86ObPO3iv9GH8k4upRsD/g6ti5mrpgnCmiRt2KRYOnMzFFGA+AR7Ti3dTV2vi3bVjMqi1ZrLusa+wX+2AU8JbnU85m2Y6nH46ALzO3I0gDP/SHzfDwwotHCTfeaAcq/XFIAxTdQjVGwzPZPJKCMiaHbI2/N76mlqp5ONhzupRYi+2NbDmhBf61LJS/s5tJpt/CJGpD4BvEb60GsWggwAXrnQvRP2Wm2jzQdCPfsPg6xHlkoFRMV8HiuvjlkqndmTPZ9uc2NR1kaJwRP3PhcIk6YlZ4qblFD5q+VlsykQKftIzZCZHUPyv+TTAoRXDxPO8tYfh/kMSBvi7VLx/cB2j2Dwxw8JE8l1lS33zOsF0B4eDI5aD71NdWHzQ9kSs28kOUskBfEcd/s6KH6n7qX1T7HUNNbJIe7L0Ipve9egi8chSjFEC9mcBwWKV8a1EYFP/UK0TC1tLyBqYfAqHal3w4fIvmUjv6CnpxFPHu5vfc2DGvfR690+esvMyW7wO8F6HcU0U62g63fzzX0vf6jN3+liLHZwbEsNzrUcqbzOYe0hzb/G+ef0STAVyyoZQAZ4myP/BTs+wXvHCVE3cW8Ts2rINZjuK5Xo3qvbJp201ho1MxwQWorxcr7Jy0Y4kNd2cKTrRdHh+ecFSEtBc26Q8CEZeAJYLTzv3JrBhDw1hf7Oum9Cl8N8tMlafnog2seSm5hrZWoAvkD62QesU3xOcVndwmiQQpZuj/4QweKaSGLw7ZHW7vfNf/ECQBbUZnmfT18HB7ew3JMJR+KAoO1z3uS7Jg1OMiI39LPRTUVWqx0duAPt6hAkYhiU6Z218eIDwXLJc2/K4bhnI3TeAH9M+jpJ+gfHPqsqo6IswwZhlZOpHY/kJj4ihuZH+3bdrP+ObajRNIAcvAM0YYE4WK5wnnq5J58tclWepnRx+p/FJNe/n/Boyv1JP1VOWkuffKkWRHmGCIvLbSJdlLsfx+Q87q7kQoLssvJIanvgQtdY6TOi3ZwOLYjH34bpy/2B2KjihZtAn57CtyBDC3xXLgoQmYqfwbE7oW3Jl9peQEle3K30LVDh1bOyZOE25eyI89ieO4PMwMNSE5koNoCTQtlJ9pSFig1CBIXy0BoefWXzgFIYBFlsUt6MmFAk0Svtno0jZ+xDaSR48AvTE9obaof5E0U5vhuJmipwFOIcrCqAV9xp5P+vGHfvFzvbUjxkMbkBqW8wYb3ojCxvIwzzQszEk+PsP05/RLzKZNt2BoS7JrfHTjxdnvOVaPEdskhECMiuZshxOYw=Question
Hhrjsy8grMPv2XVc8WfzNbtm9D5rJU+CwKatO6xT/ndAtjwbUqncsonS6hW1lzi8VmKlcwuQ0YCMjAQoZkKWhEaavNfj144bnfuzalgp6oruqX7GJ7Io9PgI/FiIjYJjjfWG7SHFS5xv9d3jncmrAuSX2Da4QuFBQ3Oq1Ukdjjg1lI4B3sVmubn8op/aOiOvWElqu54MtnU48yUfR1Sysx8IEuPhktD+tR62vxI+Ugtqde8v9WX4L+SNVAVwSstiIbbirbmXxiLyt+3xQ8c8HoOaDtzWSEQKqb9fWOeAEKg6FWVK+49cGgRh9f5fJjpPHr9al1FJWQ6jAHDmK94MlvwhaKwNDmcT2gM+2QY+swzbam2esPEnBs7UVTNTHY1sHH38CnBEm1X5O57k1G71ABFz5nSoA6eIPbdlSQtKq9H0ekVDC/M1gvTMSj26rgEVwJVHsT4vTs0KKWM/vCSUo1xUy0wwdyOkpI0mdk6z+laavlmFoiUKnCFsoXnQH+GpZLRkVvO/ZwXb6tEjvKYAMX9fKqcPfhNaJoHEMGEEzpySA3NGv0zFszU3O6hD2TBrMnwqxJLL7IDQ8qkyv0EEmVGxr7RKlNgK+r204KLNTTVOM4WKtzTugrkUpd0x73VZosQw732shYxprIhl+BlsVsSVCKRDKoVLNzt0+0D4PHitSCY+8Tw0OL/Tbg1EUcym5Eytt9R60V8F8YMAreZTTTVJjMz4wg7L0oE6yluHsROKnwLvHiC0w/fRg+pysDj66UT+E32DaNGXf/AE2ziaKG2dPlEE8nGsWHvimgMYmcv2iMCP3Blhj6/ijPPBoRC2gpzzxVsc1QxilNouxtBDxjTtf5g8dTSFR4GUYWmnuNIZq8lya3u8C5heRiSi4rFT6apzrkfnjw2kliPH9NHog7sa0bLvjtPU1Mdv3X+sdSFURL1/Mih1BrV2SxPk2sodo1Y1K47MA4izw/n+Bqio4B06bZU7ybKHIbXiguOd6/nFwsMAuV1rSLJHg++2BXeNfpL5blvbt1ZFrhecMUPAYRMALHeqc+JXBJ/Z7jWGXNkfcbyJEhAbh/YOQlj8OIKHa8obTn+jZOqZdy8wMJXWmg6/nmNZ+Hdn4r6taTLt8Dyo9EjuHoZ8Oj5HcvDkCSYh2pTCLEZXQ7OvliTCtT36w/dP9N2QVIovu7X+WidEavcqUzXEgngZpPYauyURO9tQDa1PrSCpw+I8fiqQpRUm663NgA/pMGA8nZOHaZZDf/TVw1pYtz+dzf4Mqm4/ojj4VujEurpWTeMUcDyxNqkDopYXlulv+3wSA/Btc0lHKiLhD49lHaxZOSgTY4gU7Kohlw8CsOXe768uMDTwMaMYR1S4YxuEAkz434waPtGBs0bl5fESt+rAWWZtc8MJRiQWLAdbnaFfXTMmQJQygbuowAYSRwD5dU0BuSe2+JqgX93WoROFmfl5qqmHwMku4EYh/TdikGK136pBWogIbL45KpaScpH3WTkItZJ0xAIw6pTl+IwGdm7MpYhg9evQrm84waE6PsUsV1PfVnJX/7cDS2sS5tfKTJgPPyQWPIaJ21EJ7I/yjRyUC0coWOXstOk+287c2S75CvtxrYToirQCnE6ylafggOPVskcXTsGiDEwSqjvc0x3nDTWsyLpHwz5HVXuyGENkL6VdMa8U4gFHeXzSAKIydu+9lToj6GViLELUGs2hwvvb3yNbSgvfAoeIWUSyaClyCGT6bX4KkW8skkDuMePU43RQbaqJiEC52xRALrYJlsWKdGOyGgrhf/1RarP/3DQhnOc9VRXsXaFNkNomQlRVmgw2ZmZGmP7zrMKFzmsMGC3Py6q1gyEvlGlofU/R29YhBpA7VIR09Zf0/36LFO7BiCZP/HM1wvinKpdas4hEk/VPZ6W2md1XQkzL/bOEzGKhc0RoM/kcNJE/eGW/LFuJ+X5eBkvyLbPNcY/iUOC/lO6BvwszpEYwY02yGauJkUzWFOL6DSNJbc5H6U1tJyYhgBKABeoQXSf7Kg42ItYmcIkfR+6rj/G3l2tPAU8T7d949BqGkT+69jUNWaRiuWmiHCqabOIGkqmYDD39iKJ0JF8U3rTsr8X+oja1xn6SQNBHuk57tiIubgj83AYndhD0WdaVxrYfC18P+kjDOeA2O6GXKK4BWLMWGbVhtau8SsPSL7VLVVZsf8MVMn8MXSSTk9rZw7tmnegGrH4Q3REBpYloMKYlmU/APRcaRWCr1pKr6oKzTLClUdx0NM+v2v4MnphK3HtKTBMzU+y7msK48FLJ7jUW6BEV0pfCnKArqDxRhohXKbLioRKLGFCQlj/v7A9SaLNlEockNBRgdWedm8HoBHoaLTiaFaOsSPShXxFm6SsdpD6du92JrQZMoYyUWQoQA3tQLvdBlLzAsCNMFTPTSD5tZ2euqzcNXOhGvNjQ01yNgUnvhuJI/Nq45xDqevKbYMYaqic0tcmkfK+fpSJbUIPGNRp8Vmn5RLcDBJurfECYJynow+ZfgzNQko1Ci3Li3onAdUXPCtvKq9gGXfnRtfdI5gHTXZ0k9ZUaMr578nhpLmbz6IIYI9RbpA8G/RPvJduFmAzdXaMZChHv7sFWEAgad9DN45H3Xp2AlUCscYERQ9ZwnSkrqlsP5MrXAMHd4RdrHudKPD5+Fr/3zHwnss4w3zObp0qAtSm5BeFtlUY13OM10NGtybotyU0cAEjmWzPIS8QiTkp6uiKO2Yw4ZD5V1VeE97pL1D9Kx4MP/ib5NK5aD+Yqn/15bndWaHI+SMUL9sHfXxRjiOmvQZtw599T7hjMuVolahgTUaCUoZVGYvt+XO1wiDou5AsErMsOZg6Z8Q==Question
L+xAGCO19X+nl26afiJknjX4nb/59bPoU7AchsDsyOgjMSWB/IJJAEPO5psGrkjzxykrQOUpzQmWNdX6o6bGEPiIQt8q1oEH4Dbva/XON9yN0Ley8iy7HWBiPbjR1n9SyuMoMuQF+cEfFlf8IdQUQSBbx+ThbDJQs2ZnY/dv3eQR0kM1sYgHm/ZAkwARaSZv2aHp/85PrpmomOgGyITXpRw86sU2NvGCgDVbgEKX9wcXa9O6JWN2/qEGzzzpW4qZKeF+xe5m7ixDlb2okF94C203SowpZgmJQEPTh4k3dK6wNTSQxfifTLUb39eHUzxJ97J4Tknc6BpCQCvNMMF9XeSk1Fpj5MvQITjgFNW+cJNCXQnPht+CHyRPTfAn8cGZhyUniJN1MFtl5XIKdws0d0i9kLSDvYX9ei6gvB+vHL4RQRxTzLUkgK7zMoKlJPWuB9vaFmEcdDqNYNmAl0v/+FM/6vtwobGbcM/zzXWCrN+3BlQ37ta/kXS+lhc5JNW/Vz2xfC5h7wGg/AMZhU3LZErGEfE8nlrisje2eTEmx3cA5KkcxvjTYCZ1Lp7svth2PMzrpS4b6LZ2FyOh1/INkfEDKfetoi/FDZ/EGbLTS+vFEBy+H9oXMxpj5sHa+d5XeetBHWYNofYiCg2Su07oMOO9jiBJx1SsMzeohpdNoGSKFHla9u3u1WboSRc43Yq/czrphsgZki8bcv1brC5cRSdUtVHDQOeds3+H7Wgku9htOOeyEGrNDfksBhvYKEpLUTkJ7DbRxz/xXflt9lmpu8Ip4xP8rj/LT+SSCavIb+N/Y/KOPX0B5tNbyKN+0IbmN+RyM10sxYZPKQfxijgOGmqCMbu/d1QnEkwt7658RgBCqtqotmzfHpTSMR1J9wbMSU1iJCStovnm3P/YEwzRNHZ89RG026sZ/9v46TF38i/aTlc8jyJ7BRV+BoFrp9GSimJjnW8mQMAUiqZ8wthAqgp4oSr4hXlEeoOX1j4Zzv2JIIVlfRae/C4HjEUN+GwUL6T66EXo3adpJU+IiUsL96v3/X684XCLd/cd5R1wW/Pvrw19pmikS+JqwmGfqXASInAUAYLB3p0oMtid9d9uwEJfOIAwrbQW5HArczns8703zhcnrP/Xk4BVDMnEhkh0iAaj24FnDDyvYMYUdPaNZFVF9mh41RlN70AIRu9aSSDJqi7QtWSnpp/CVpYyKL7ZrwfChneI1fOQEl24UqTcYi488s8lUS2JVS6ujiXQu/iIYwCT3iM2ezYPFhODg5e4x1Vzrx4Kl7B93py2cQ/vSFgRbqu7imVkVRqIweqV0mh4PE8slz5LV32BfnAXPYYgeNpz/CzOo+Oeq6PfmEeZ0thLDIsR7PxEF7NSQVkFJ3LEMjEFtZSZ3v+mbqZhL8tvnTFz7yy3CYb+leMIp9EoO1MEtGqlAWBpROSCMyIJt14SgZ1tDfSNOTd5hrdnD12EaSuFndf90KPqJFdvG8sVFN8EwhlFxlzxPlW3hpHMJB7Sz92Pq4uhEUmhvNb3sxz9WalRJzxo+dHDLC3+UeEU95ax/gkomZGfjHMy5Rx0WTcU6dVPOPbF0lpz4lnx3tSqbsfsmoIJPu2TlmRs
Question
/hpeWGB1oJPQkFevs/oBqzsT8MEyMF6ALzq6t8vA0MwrYZjU7sB7pclk9XGY0ssrGb8gJbaxx3IrOosEeftE+nZyZAddp+/wb293VxHrRBz/KP5Xa+6uePWsYO7IzfBHhBO4wdOkXU2Hfe6mlqqSajYeXWqwsRhcwxpMtpf3Iu/lnF9UJHJzmtwPIeNI/Qo2XaL2SdQY22MBbOd0I1fBZ7y9ZNJZhHkhEJJ6LRygQNSDIyi9b06RTR7f1Ppbs45qYcVHuCFoI3LzvswwbNRNA2ZNubkitPYk+QQwpDTKKwE6gCOCuRFPrfor/0/G32QX/3ZzHd1FBWPKJoJXBMdLRwNTZu3BRI1kGVY1GmvT0hnVH/kv8aBj6ZoZY4anskLKz372kHymJSCDbChNpvV1J3UMsKa8FbebjUYUO7pbGqnoqH0aeQtwfUHQLele4iEfDci6iL7ikNvogO8SWhswCHydD1fgGIo/KxZHBKhJkpPVD/OqRBTd7Dl7P94oJziifOLCQFxYEd7QWvCG05/Tl/yNXHY9lKD4XWPToGaL9S24zPRi3glyb90D8tcMDJVyAAUNxwMtqGaZVzolw8WM1ymfFPrggC8g3tkTkbQXSoyF5pkwDo/UkREeQT1BTmGimkTBZ5Pp3m9EqvvcZmxWZCRaUcjffyFTZx85J3UeVfW+NoGHoNJupGKNWkuCmz0pchWCG9JcQW/V2JIfCAQZyRbmbwTWunOwpkl276/VyTEqCHBzk3YOnpTsvWfXr6HiJHMmhTMd+GBXSGaOYm76omNXB9v801EWKMgEpQJnWJsFjaHRJLgdI7VCRR8k3cQ01qNwCmvEZ9VvMSCNQ0Nmgryz/tsKpQHR3IyU3EtNU7Y6TMTaxOBnWXoBD9FlBA6+EJgoOKvlMeic3DPm9fuCRGvDa+n9rt0uBskrVA1dp3qS8X2HRn2AheGjMu0CHZdS+3H5daO5L0KUdTIxMP4IFiuziMo4N3gsipa8i+58BdVPmvEXHcUB6JImECDAN5r8smeTmsTlmFlehGNtfAc8e2xMcXofHbrxtIw2KRymspNWnuFHSpgZUr8yO6J2eEwb5N25XxfwM5h+rCF+XzF8dp1i7QcLDdteWVawJMioiag72f7UKpQoJwfMlfiOwNKuCzFgJt2BTHCYz1RLG/TzgF6ghzGTR7ya4gL/9YrA2PVnsm7Dak4HaYtsCh42LCQDT9tWfB2P58ftepu+LObvkB1BuNIuvVv4BWAliIKZ1LDoflPxznIRi9Z2bR6DSacjOroNkCfPLLCkpDlLqUvyEWisJ5oQWKNogWzf0e1HMyxxQEgD/xEAjJY3xW17ej94GywG6b1YFh1CtnqJWQG7KwC1TEkl2/MOz5f6hn+jN30oGKRXB7a1QczbqoFNtePkwyzTw6fjaF2zjuohEb2qkgyn2+bxkpVIQtthL5C6x7OyjId9Me5wsYsBCG0OccYQz529NfTKwYVcbIbTJ4cphbLLxV/syHHB0d0cygp2buhtHSipGC3Xj0yaJHl6iMVY9Skn0seLxvxcGiRq2fLtoc/5ZPUFF4WKvIq3mzkDnRAmfc4CchFsWA8/Jqx4+Icvt+69iwN1DSbbgNf9IGwUj1dbMF4gWb+5jtHDrLxDE6Y7I8fASMsJiLgATX3v8jQpcu2vFeXu0IR/spdvq5AtJjBcmJ7tUODYYpMfcNXAvkZVJc1F0euoSdA4BFc9v3VBwoSEGFBxcoxliJ+EAiAoD1cyRdcyyFRR54aMvhDtaLe5WvXz0yCR7l3UbtganTDsxwSvvU2Nspxw7ZCkCqAWbCuRGbDl9aNsTX11tKtRRPYympy21TgxkNWdsAHz3e0Ypg50oAb4w17LcL4XKTUcH12DGmrNoG4M1Ukq0za1Ovte9PZOhZ0Yb08rrhvqqtARnZbH9kJqlMej1aTYcFEukCeLSey+I+WEM3ei+bObCiVe9Ztj63Qb5EJdZr/jYXbaDRHhcrS2sVvF3AITFRSYyViaEC5bZgV9Kf0FQMkgFdfhnzZjZQe7a1qkRqPsLNJ2MuQILvMmfzk3jD+koR1EHBJiG55LlJwXwWuSGbRaXvtTRc9Zdi6xe4aPeYf18C36QvbQi0nHUzfyDzonhoOeXR9Txoo8sPWwREb1KPn8e5S8+r6iG3p2gKl7fqS2yDQx9iwWzCfZGtuNz4pV5UhkzBJE00J14fIM7RlkZrsQyW5ehdd/U04NFkOXLCTWX0jHvcBqjIa9guyMUd1xrJPVmpl+ongF5z37sKzZAEIFKSn10QYiCh85t84dpT4UALMVyAHfoA67QvcE3f6jp5heIzrbk7MuoljEB6uhPJ5nd26Y0Yc5CFyYQ/U+elpgxYFlsSU1c9HthmgkSB3tWLo0CXrdjfIvVYHGESuQ+6Nr5ziy72XHEgFp0mYPR2v1z5cOAMu6nWVlEDqQ9nYjo8Mfm6Oh5VlCD9zqsRXsvkbT/+hdMxXCuKhQvekD5X8PFe06WQDN25GknSSsarcsGzfC5A==
Question
BXNcQ9l8z6p+dFRwhCrsiexAbRGBgxEW1Vr9dYNh5catiOHCcYe9W9aKsO2Gsj6LsfgJtFZOQB8u7olovAoKT5jpUy0lBzQXQMSMuIlEjsckjL8Jet+i7TK7eKeSxE5zsiP7pN5Tisgt1Cw4dwbwHJxc1pB/Hi5Ep4Bx2XBWDfzDYWwePxT68p7P875/ti9meFu8gHyksg9j2oPdmJ2234mTJ0ZUofjssAeMgxjDxqmH9ZF8Z/xASgg8FFJ/b0MicBDs1iK4VwxhNzopWShOW288qWLwvTtc/JqyeT7ZLtrNXfj0pwAO9/vwdTuX1XATdZ02MU3b6om4fRwnBgWZ3dPzvxonkboYecIJ6fCIhCO2PQa1wEJabtyLkRCiMCXq6zJJDDO01s6dpfhwG/+MfZgDYJgQAhj4lrgmhNRIpumWtOr9+Go77yq6sMAvu5POarLJ3rVytoCRbpcyc/CvO5CjjKLfzWKIquYRevo1iLkByM7O3+/HBlr8CLquxiympCVkyJCtVgxTuWJ7yPxrzP+gTwTAbc5cozFATWgBS2sQKXd005KWBNrECr4WLA4/syKRte2yZ/ST1sV4+aijQi+aDaKWrUnHBFkXFxvsenlnmwKqRBIc39nRouJ2WFNxHc+rpNsAvJJWpOTGIqrC1S2KOMmlSxB/lqjGn++eb5E0qnNKunyW3CgfFE6q3VPMeWJqU8i9WqlP1OrdzufQAUS6EUEA6ByTIW3JhYp7M5Gm0vM2/aRD56fut5uNs/3VKSr05nbFj66ZiE221WTTKKGJc3qqIwkcLjO2OOIIM40H9UnherOzJwo7fcAIR3AMPMT/d9qEpR2Bi/nkD+cGGIGRgyBnaabzBsqofeZVXqxXlFbEXz8vgHOAsP1huUmKdhXOEgknFlxRuRDE0bCmyNEJhxWeXGOHhDZkNQn6EU4pyJYJ7nMg7Cfq66YCFsm0Gc45/Sttt1ZQXBVpcYAPIh+uomsWWjr5QkkwXJy6HfZbJV7uByTGjQ8BeqEXQFbs6TFMffWnh7Qdhm2sH9JJk9sbcyUVWYG5P11LD/0cY4d05i7jZBBEJuMdR9E0BKaeQu8qLWbKZh1rA96qqip6Kemsouj9WIBvu6CljHgTUMBu8Ja8BhTUuVhkdguDP85CArKLUMZwrnierNakqJtbt+TlI68ikRcIUpWnrHTqVqwd9eYfqNEv22W6X/a8glfjSMMJbf2i+aleJG0oBSvDo34xesOdqGQcqlzfPqHnyAOjfcBUmmZyqePtJKyLaDwT4y23FGEHNG2DNe5v6mBzGO10icyl6hIYQeVGtCkwFnrAkTn3PUrWpubUGEAZjevk6nvXddR555oJDZ24AnUoXOHMmu4PifBwYUPhvsfTVzvk2LpWWQ1lmq1eyhX4jhkXDwe+MeQ1DTru7VqJWiNy579wDNwFsTT0VHtJgLS9wA1cK6M9IxNVYnkYdFjNpoB0X0kDZiir/0RdldrTE2xbDUQwYRD20ZGxZI8SoSHSiYeDaDCf+Zy28GJW2aKh9gjnqZi2tevdbvZaCxC87whSqwVgKkqXHpNqpj12YQ0/FTb9vvEtsvsldPcbc73sub+nuUS4CC99PVz7R18tULFW5T7fA85cLVUiIbI9A/1XLQqerLwQksJ9ekLaHwnqNCLMqHNJLPU1BApx9YHBdRKMq3TuY9GkR1ZsXtOOSF5jexYsLPWtlhTyvkA+Z/qVvJaKLASgSO1+vMGXFD9usSwzTG9o1oNiZLwNrDzAeSCigTCuczWoPtalAgna/RO22ggDOj/shm3W1UwjwG2BqmPkdgxT/91ygdcVlT0bZ+om7Dy3VwVGeM8cp4PrEx8YygTphG8mWxJfMbRyJpMu4WZcNoxCCa0nzZHx2Y9kntpe4KbI0TBaalRvm2ffEF1iafA2j+eCEG1kbo7jRWDdNomwUPIeHXHj8jHR1ni6PGGawjMfD17e769qPxBmtLsZ8hd3t5mzhtFvK1jUM+HdEIDAoL1osEZ5BuIqNvxoSGXSMmNsKRf+Om9JwU1bUnvzCPfpbd0wW9xKxVvu84BO6RhcgZHo1rQSNDT4XaXNIXdluTTGZ0p5hL/iP0fdVFqCp6LErVx8hHNgONo1BY4lv96uGk156WaneMhgqZrqvXOKIyyVfI6mMmAD/U1RJ0xiqxEp5skLkd3lykF1Gvay9Gdo651PWvBwzVsNIch4sxors/2S8IcUz/G7Zg/ThcpgMkVZoQ6RjfGgBGDtdSws6H6vYfw35l0B8aPO+nmmFswykoUutZqtMR5QE6isqFU8ghNhrT5h+hFE2m+JZ1pUHo+C8u8nBcaVyiXhlaC/Fdyyzmswh9degtRk/SDMZJtOFvZh0UKDWicoPzo=