Chapter 2. Analyzing Enzymes and Enzyme Kinetics II
Post-Lab
During the lab you collected absorbance data for the replicates of the different treatments in your experiment. Using the standard curve shown below or the equation that follows the standard curve, convert your absorbance readings to concentration values.
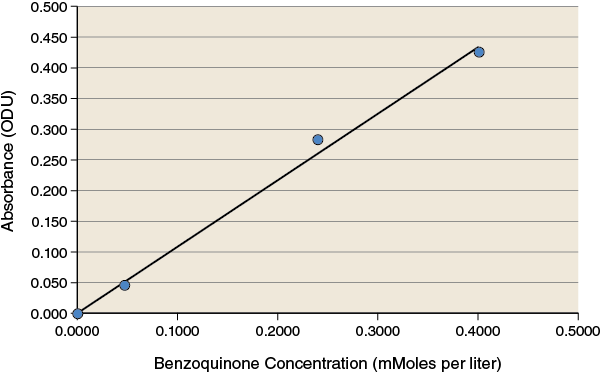
The standard curve shows a linear relationship between concentration and absorbance at 500 nm over the range of concentrations used. The equation for the best-fit line for this data is:
You should think about and be prepared to answer and/or discuss the following questions when you come to the next lab meeting:
Based on your hypotheses, what is the most important part of your data: the absolute values or the trend(s)?
How should the data be shown: in a table or a figure or both?
If a figure is appropriate, what kind would convey the information best?
What is the best way to deal with the fact that there are multiple replicates of the experiment?
Your group may be asked to give a short presentation on your experiment, so you should be prepared.
If you have a laptop or notebook computer with Microsoft Excel, bring it to the next lab meeting.