Chapter 1. LAB 6 Managing Data III: Hypotheses & Experimental Design
Learning Goals:
- Understand and apply the elements of good experimental design
- Understand the differences between positive and negative controls; null and alternate hypotheses
- Learn how to collect data for testing hypotheses
- Learn how to use statistical analyses to determine if results are significant
- Learn how to organize and analyze data for written communication
- Know the sections of a lab report and how they relate to the primary literature format
Lab Outline
Activity 1: Designing an Isopod Behavior Experiment (prelab)
Activity 2: Testing Your Own Hypothesis
Activity 3: Communicating Experimental Findings
1.1 Scientific Inquiry

As we learn more about the living world we discover that some animals have abilities that far exceed our own. Horses run faster, cats see better in the dark, dogs detect scents better, and the list goes on. Over time humans have developed instruments through technology that rival animal capabilities, cars now travel faster than horses, but there are still many areas in which animals excel and we can benefit from their unique skills. Dogs are still our best agent for detecting dangerous and illegal substances in our airports, but how were these skills developed in nature? Living populations are inherently variable and some members of a population are able to withstand morbid forces better than others. This is “natural selection”, the process of evolution that results in species that can survive and reproduce in otherwise adverse conditions.
Toxic heavy metals are potentially morbid contaminants that can occur naturally in a given environment. When a species encounters a toxic habitat it must be able to cope with the toxin, move from the environment where they may encounter dangers such as new predators or limited access to resources, or suffer the consequences and die. Those individuals with the ability to cope with the toxin will survive the selective force and leave offspring in the next generation.
Small invertebrate crustaceans called isopods can be used by humans to detect the presence of toxic heavy metals in a particular habitat. Through selection these remarkable creatures have developed the ability to accumulate and sequester heavy metals in their body tissues without suffering toxic effects. Because of this strategy, one can simply gather isopods to measure heavy metal concentration in a given area (Paoletti, and Hassel, 1999) and estimate the degree of contamination in that area. Additionally many animals eat isopods so as a consequence, the heavy metals in their tissues will move up the food chain (Hopkin et. al., 1986). This method is great for determining the relative amounts of chemicals in an environment. However, do isopods have the ability to detect levels of toxic materials?
Investigators (Paoletti, and Hassel, 1999) compared the effect of organic vs. conventional farming on populations of isopods. Conventional farming uses pesticides, organic farming does not. Their results indicated that isopods are more likely to accumulate in the organic farmed area. This implies that the isopods have the sensory mechanisms necessary to distinguish toxic chemicals from non-toxic chemicals. These results are substantiated in a study (Zidar, et. al., 2005) that showed that when terrestrial isopods were given the choice between food that was contaminated with cadmium, and food that was not contaminated, the isopods chose the non-contaminated food. Animals were videotaped for 48 hours. Animals visited both the control and cadmium laced food, but spent significantly more time around the control food. How do these animals know the difference? Is it the smell, the taste? How do isopods have the ability to detect levels of toxic materials?
The process by which odors are processed and interpreted by the brain is remarkably conserved from insects to humans. The odor is first recognized by olfactory receptor cells either in the sensory epithelia of the nasal cavity in mammals, or antennae in insects. The odor then binds to olfactory receptors that convert this sensory input into an electrical signal that is sent to higher brain centers (Hildebrand and Shepherd, 1997). Usually the more receptors an organism has, the greater the ability to distinguish odors. This process can evoke many behavioral responses including chemotaxis. Chemotaxis is the characteristic movement or orientation of an organism or cell along a chemical concentration gradient either toward or away from the chemical stimulus.
Taste is also a similar conserved process for detecting chemicals. Gustatory organs, the tongue in mammal, and legs, wings, mouth parts in insects sends information to higher brain centers and a response is evoked. Typically, the taste is interpreted as sweet or bitter in invertebrates (Vosshall and Stocker, 2007). Mammals can distinguish a wider range of tastes but the process by which they do so is conserved with that of invertebrates. In certain types of terrestrial isopods, both chemosensory and gustatory receptors are located in the end of the antennae.
You will have the opportunity to study isopod behavioral preferences in this lab based on an experiment of your own design.
1.2 Background
What is a good experimental design? Would you know a good design if you saw one? How would you design a biological experiment? Imagine that you are conducting a clinical trial. In your group of patients, each shows three symptoms: pain, high levels of calcium in the blood, and myeloma (a type of white blood cell cancer). You prescribe a new drug called Zoledronic Acid to all of the patients. Immediately, all of them feel better. Pain is reduced. Calcium levels return to normal. And none of your patients die from cancer! This is great, right? Have you found a possible cure for cancer? How can you be certain?
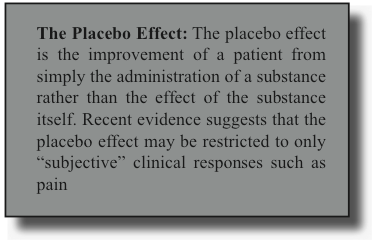
You probably have guessed that the sample clinical trial given above has a poor experimental design. There is no control. In order to draw conclusions from your clinical trial, you must have at least two groups. One is the control group and the other is the experimental group. The control group should receive exactly the same treatment as the experimental group except for the variable that you are testing. In this scenario, you might have divided your patients into two groups, each with exactly the same symptoms. The experimental group would receive the new drug Zoledronic Acid, while the control group would receive a placebo. A placebo is an inactive treatment, such as a sugar pill or an inert drug. You would expect that the group of patients that received the placebo would show no improvement since sugar is not a cure for cancer.

An experiment that you conduct that has a “known” outcome is called a “control.” For example, printing a test page on your newly installed printer is an example of a positive control. A positive control is used to verify or repeat a known effect (the printing of a test page) to make sure that your procedure (or printer driver) is working properly. The alternative is a negative control. This would be an experiment in which a negative result is expected. In the clinical trial example, the group of patients that received the placebo would be the negative control group. If your negative control group (that received the placebo) shows a reduction in pain, a return to normal calcium levels, and no cancer, then you know that these effects are not the result of Zoledronic Acid (the variable in the experimental group) and must be attributed to some other factor.
Setting up good controls is only part of good experimental design. Scientists try to get the most information or data from the least number of experiments (as you may do when shopping, you try to get the most for your money). The experiments that are conducted in biology can be quite costly and many utilize cells, tissues, plants, animals, or humans. To conduct poorly planned experiments is not only wasteful, but unethical. Therefore, scientists often spend weeks or months planning a series of experiments that will take only a couple of minutes or hours to run. Well planned experiments are part of good scientific practice and are more likely to yield high quality data.
So, where should we begin? Start by asking a series of questions, many of which you commonly asked as a child when you first explored your environment:

These questions lead to hypotheses which are directly tested by further observations and/or experiments. A hypothesis is a falsifiable statement based on your observations, or data. For example, this hypothesis is a falsifiable statement: “Zoledronic Acid reduces the level of calcium in plasma.” A strong hypothesis test (i.e., an experiment) is one that could “disprove” or “falsify” your hypothesis. In our example, we can test our hypothesis by orally administering Zoledronic Acid to different patients, drawing blood, and measuring the amount of calcium in the plasma. If calcium levels decrease, then the hypothesis is “supported” but NEVER PROVEN. If calcium levels increase in plasma, then the hypothesis is “falsified” by the data.
An example of a statement that is not falsifiable would be, “Zoledronic Acid causes plants to become unhappy.” How do we know when plants are happiest? What does it mean for a plant to be “happy?” We do not know what plants enjoy doing and therefore this statement is not falsifiable.
Scientific experiments are designed by setting up circumstances that challenge the hypothesis. Your design should predict the kinds of results that would support your hypothesis, and your experiment should be designed to be completed under time and resource constraints. If the results of your experiment do not coincide with the predictions of your hypothesis, then it is unsupported or falsified and you must search for another explanation of the phenomenon under investigation.
In experiments where cause and effect are implied, we often make use of an experimental design that contrasts the null hypothesis (H0) with an alternate hypothesis (H1). In our clinical trial above, the null hypothesis would be that “Zoledronic Acid has no effect on patient health.” The null hypothesis implies that there is no cause and effect relationship between the treatment and the results. If you conducted a clinical trial and found that your experimental group and your control (placebo) group showed no difference from each other, this would support the null hypothesis.
The alternate hypothesis implies that there is a relationship between the treatment and the results. An alternate hypothesis is that “Zoledronic Acid reduces calcium levels in the blood.” Often, there are many alternate hypotheses that can be proposed when trying to connect “cause” to “effect.” You can compare a null and an alternate hypothesis by using probability. Probability is the likelihood of something occurring. You can think of the null hypothesis in terms of probability as “an outcome based on random chance.” In other words, the null hypothesis states that there is an equal probability that a patient in the experimental group will have the same outcome as a patient in the control group. Similarly, the alternate hypothesis states that the experimental group always shows improvement, and the control group never does.
This brings us to the two simplest outcomes: either all of your experimental results (data) match the null hypothesis OR all of your data match the alternate hypothesis. In reality, the data almost never match perfectly with either. Because of this, scientists must determine whether the data are due to random chance or due to the treatment that was being tested (e.g., Zoledronic Acid). Scientists use statistical tests to make the distinction between chance and treatment effects.

Statistical tests are based upon probabilities. If there is a high probability that the data are due to chance alone, we cannot conclude that the experimental treatment had any discernible effect. If, however, there is low probability that the data are due to chance alone, then we can conclude that the experimental treatment likely had an effect. We can never completely eliminate chance as the cause of a given result; however, we can say that the probability of it occurring by chance is very low. The probability, or P-value, reported in statistical tests is the probability (likelihood) of a result occurring by chance. But at what probability, or P-value, would you conclude that your alternate hypothesis is supported, or that your data is the result of the treatment rather than chance alone?
At what P-value would a scientist reject the null hypothesis?
As a general rule, scientists use a probability value of 5% (P = 0.05) as the cut-off between chance and treatment effects. If the probability of a result happening by chance is less than 5% (P < 0.05), scientists conclude that the treatment under study had a significant effect. If, however, the probability of obtaining a result due to chance is greater than 5% (P > 0.05), we cannot distinguish chance from treatment effects and we must conclude that treatment effects were not significant.
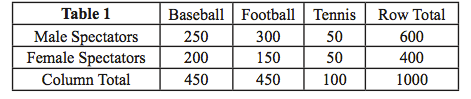
By the end of BIO205 or BIO207, you will be expected to design an experiment, collect and properly analyze data, and visually display data in the form of a scientific figure (tables, graphs, etc.). You will collect both qualitative and quantitative data, and you will analyze these data using descriptive (summary statistics & histogram), parametric (regression analysis), and non-parametric statistics (Chi- Square). Prior to lab, you should review the Knisely text’s Appendix regarding the use of Microsoft ExcelTM, if necessary.
1.3 Resources
Hildebrand John G and Shepherd Gordon M. 1997. Mechanisms of olfactory discrimination: converging evidence for common principles across phyla. Annual Review of Neuroscience 20(1): 595-631.
Hopkin SP, Hardisty GN, and Martin MH. 1986. The woodlouse Porcellio scaber as a ‘biological indicator’of zinc, cadmium, lead and copper pollution. Environmental Pollution Series B, Chemical and Physical 11(4): 271-290.
Ibrahim A, Scher N, Williams G, Sridhara R, Li N, Chen G, Leighton J, Booth B, Gobburu J, Rahman A, et al. 2003. Approval summary for zoledronic acid for treatment of multiple myeloma and cancer bone metastases. Clin Cancer Res 9:2394-9.
Paoletti Maurizio G, et al. 1991. Invertebrates as bioindicators of soil use. Agriculture, Ecosystems & Environment 34(1): 341-362.
Paoletti Maurizio G and Hassall Mark. Woodlice (Isopoda: Oniscidea): their potential for assessing sustainability and use as bioindicators. Agriculture, Ecosystems & Environment 74(1): 157-165
Seelinger Günter. 1983. Response characteristics and specificity of chemoreceptors in Hemilepistus reaumuri (Crustacea, Isopoda). Journal of comparative physiology 152(2): 219-229.
Vosshall Leslie B and Stocker Reinhard F. 2007. Molecular architecture of smell and taste in Drosophila. Annual Review of Neuroscience 30: 505-533.
Zidar Primož, Božič Janko, and Štrus Jasna. 2005. Behavioral response in the terrestrial isopod Porcellio scaber (Crustacea) offered a choice of uncontaminated and cadmium-contaminated food. Ecotoxicology 14(5): 493-502.
1.4 Lab Preparation

Complete the BioPortal Quiz, which is designed to gauge your understanding of the prerequisites for this course, as well as your knowledge of the required content. It is your responsibility to review this material, if necessary, then watch the vodcast and read this lab. Place all notes in your lab notebook, which can be used during the Pre-Lab Quiz.
Goggles are mandatory for this lab! Each student should have their own goggles.
1.5 Activity 1: Designing an Isopod Behavior Experiment (prelab)
Purpose
Although there are many critical elements to a good experimental design, one key element when working with live organisms is knowing as much as possible about the organism (whether plant or animal) under study especially as relates to the topic of interest. For example, if you want to use isopods as biosensors of chemicals or metals in the environment, you may want to treat them with and without that chemical or metal and see if there are variables you can measure that show a significant and consistent effect. Without this information you would waste valuable time (and money) using an organism to study environmental toxicology that is not suitable for the research.
What do you know about isopod physiology and anatomy, ecological niche, and behavior that allows you to develop a testable hypothesis? You should read the literature on terrestrial isopods and consider some questions that you might want to research. Ask your instructor for help with databases or journals to search. Following are some sample questions you may want to answer before you pose a hypothesis and an experimental design to test it:
- Is light or heat or both influencing isopod behavior in the wet versus dry experiment? Is there a way to separate out these two variables in an experimental design?
- Are sponges a good replacement for normal isopod burrowing places or would some other natural material work better, like tree bark or leaves? How easy will it be to collect data using alternate microsites?
- What chemicals do Long Island isopods come in contact with in their natural environments, e.g., what is the chemical makeup of detritus? Are they attracted to some chemicals and avoid others?
- Does the type of moisture used in an isopod experiment matter? Would rainwater or detritus-treated water serve as more natural alternatives for a wet versus dry test?
- Does the level of moisture or humidity matter for an isopod? Can it be too wet?
- What happens if you assay the behavior of one isopod at a time in the arena? Do they tend to traverse the same general pattern or is the pattern random? Should you test each isopod individually instead of as a group, i.e., do they influence each others’ behavior?
- Can isopods differentiate scents, such as scents from fruit commonly found rotting on the forest floors?
You have already had an opportunity to work with isopods and learn first hand how they behave in the arena designed for lab. You will now have an opportunity to test your own hypothesis either using the present experimental design or making modifications using your own materials. Plan a possible experiment prior to lab by completing the following steps on your section discussion board.
1.6 Learning Objectives
After successful completion of this activity, you should be able to:
- Diagram an approach to researching information about a topic under study.
- Locate a primary literature article and book resource on isopods.
- Produce a plan for a basic categorical experiment with at least two categories and a control.
Procedure
- Review the literature and preliminary experimental results. Review the isopod habitat preference experiment and results from last week’s lab. Search the literature for background information on isopods.
- Define your variables. Be creative and choose experimental variables of your own. If you choose a variable that requires reagents not provided in lab (see materials for Activity 2), remember to bring that substance or object with you to lab. Please do not bring substances that are dangerous (to humans and isopods) or illegal to lab.
- Define your hypothesis. Based on your knowledge of isopods describe how your variables are likely to affect isopod preferences. State the assumptions you have made while defining your hypothesis.
- Describe your experimental design. How many isopods are needed for your experiment? Will you need negative and positive controls and what will your control(s) be? How many times will you repeat your experiment? For each repetition, will you use the same or a different sample isopod population? Can your data be compared to data from the wet and dry experiment? How will you set up your isopod arena? Will you need to modify your isopod arena set up, such as remove the lamp?
- Predict the outcome of your experiment. Use your hypothesis and experimental design to predict the outcome of your experiment.
- Plan your data collection process. What time intervals will you use? If you use a time greater than 5 minutes in the presence of light, do you run the risk of compromising the fitness of the isopods? How will data be collected and recorded? Will you measure other variables, like temperature, pH, etc.? Will you collect any timed data?
- Produce a procedural flow chart or stepwise protocol. What will you set up first? What initial data do you need to collect, e.g., temperature of the sponges? In what order will you conduct each part of the experiment? A step-by-step procedure will aid you in the successful and proper completion of your experiment. You may have to modify it once you begin your experiment.
- Determine how you will analyze your results. How will you organize your data to show trends? What type of table or figure or graph will visually display the trends in your data well? What type of statistical analysis will be performed on your data?
1.7 Activity 2: Test your own Hypothesis
Learning Objectives
After successful completion of this activity, you should be able to
- Set up an isopod behavior experimental design
- Perform an experiment on isopod preference and collect data
- Perform a chi-square analysis on categorical data
- Determine the number of degrees of freedom needed to interpret probability levels from a chi-square table
Materials
Isopod arena (8” culture dish with sandpaper bottom)
85W flood light on ring stand
8 sponges
Isopods
Solutions (Room temperature RO water, 10% ethanol, 10% NaCl, 10% sucrose, and warm RO water)
Transfer pipettes
Light meter (or use app)
Vernier caliper
Permanent Marker
Ruler
Thermometer, pH meter, and balance
ice and incubator (set to 37 °C) for warm water
(add to this list materials you will bring from home for your group’s experiment)
Procedure
- Finalize your experimental design, procedure, data collection and analysis with your group members.
- Collect all data in your Excel spreadsheet.
- Post your group experimental design notes and data to the discussion board.
1.8 Activity 3: Communicating Experimental Findings
Learning Objectives
After successful completion of this activity, you should be able to:
- Organize data from an experiment in a way that allows you to search for patterns or trends
- Tabulate statistical data
- Graph data in Excel in a proper format (scatter, bar, line, etc.)
- Properly format an Excel graph for use as a figure in a lab report
- Write a figure legend that is descriptive of a figure or table
- Outline the sections of a lab report
- Construct figures for the results section of a lab report
Materials
Isopod experiment data in an Excel Spreadsheet (student provides)
Observations from isopod experiment (student provides)
Statistics flowchart from lab notebook (student provides)
Knisely text (in lab) and Statistics primer (Bioportal)
Lab report Rubric (student provides from Blackboard)
Laptop with Excel (bring if you own one because there are only 2 computers in lab per group)
Procedure
- Every group member should work at a computer because you will complete this activity individually but discuss your data as a group.
- List all of the data that could be included in your lab report such as the group and class data from the “wet versus dry” experiment and any other measurement or timed data you collected. For example, you might have total mass of all isopods at the beginning and end of your experiment, temperature over time and number of isopods “not under a leaf” over time.
- If you used experimental replicates, you can use descriptive statistics to describe means, standard error, or other useful values. Your descriptions should be relevant to your data interpretations so a reader can follow your evidence and lines of reasoning.
- To compare the number of isopods in each category, convert your data to either ratios or percentages. For example, if you tested the effect of four different chemicals (A-D) on 24 isopods, you might have discovered that 0, 18, 4, and 2 traveled to sponges with chemicals A, B, C, and D respectively. What would the ratio or percentages be for this distribution? Why is it better to use percentages in this case rather than ratios or raw values, especially if you are doing replicates or making comparisons with data from other groups? How would you state this result in words? What does your reorganized data tell you about the behavior of the isopods?
- Discuss the following questions with your group members and record the answers:
- For which data, if any, is it critical to know the exact values? Should we tabulate that data? How should the tables be set up? Can this data be described in written form and still be just as understandable for a reader?
- Should we graph our percentage data? What can a reader gain from the graph that might not be obvious from written text or from a table? What type of graph is appropriate?
- Analyze your isopod distribution data using the proper statistical test (see statistics flowchart). If you collected continuous data, can you apply any statistical analysis to that data? For example, if you recorded the number of isopods under each sponge over time versus the number of isopods not under a sponge, would a correlation analysis make sense for your particular study?
- Discuss figure preparation as a class by critiquing sample figures provided by your instructor. Use the Knisely text as your guide.
- Use the report rubric that you brought with you to lab to write out each section of the lab report in your lab notebook with several blank lines in between each for writing. Using the “Format and Content of Scientific Articles” from Lab 1 as a guide, write out the answers to each of the questions in bulleted format under each header in your lab notebook. Although you should write out these answers in your own words, feel free to discuss the questions with your groups members.
- If there is time, complete your data organization, analysis, tabulation, and graphing individually.
- Turn in your lab notebook copy to your instructor.
1.9 Self-Assessment
These questions were taken from previous exams and are meant to represent a sample, not a complete study guide. The questions in these examples are designed to test your understanding of the concepts and skills presented in this lab, and your ability to apply what you have learned to novel problems.
Computation
Question 1.1
ATK5dfWXgoPo5gm2CxpGwArkK+h+FZLvMhOGHB5nV+C8g9GzKVBmBEMYnByWqmU6sRAR+to67/Hheec16kKKFHKljC20Aoyu9A/iOO1b3BuEaufy2LNL1pw0eyA40CkbgkabBQZO1NxnXUUZcv/AsLDg5OJDTSWpeShvRKFvI39fi1nU1wqmtWtPioADxVDQRLALuVTKvdhklfan4s1NDOi79DgGGIO4NrPQZFHRavp+FqID9dpQHOsF8SIVnPSXzONi7XdYTV76/YHLX7PAWEb1s9SpztMJpD+olJAFzI5++f7AmJ2Re0glV9ygD0g7dnrmlOTPjUlEgnT9MF5G3IjTgnqcG8og6VaOZqDj7UFoQ4Hs2Be1uil+eJOUyFaKRXLzBC3aaDfSryDU2rRHqmufZW8=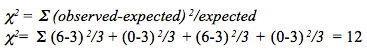
Question 1.2
vBTFjzqk/IhYpZKoawIPQ7gWA9bY1bqH3+L0eZVI7XMyBwkNl9hkCPjGaj48u2nRkUlOU2XJmemVZDvO7gp/uS0IInLPDKs+Zb+9dNklToJiRObBLIi0FV1t9w2LQuXGb8cwq6jJqqEQXlSqsyVH6eubg5APIkotZpaIXwCIHUGseUrmoGcxaACA3HaEkmiR8nMh9gMvNwVFeoyWsrzSEmbZNK/0FN9TJlokTMEKctu1lnYsKDVXGLwEw9NZ+iyTl6BOBpmBAgLazZGulRlFaQq9soVSmTmRggmz6EGUuYTfiJE/GWowXMfReTG+JIwhdtjTh+9q8IuVWphpQuestion 1.3