Chapter 2.
Three-Phase Model of Matter
Graphical Representation
Algebraic Representations
Change in temperature of a substance when heat is added or removed:
Amount of a substance that changes phase when heat is added or removed:
Definitions of the Constructs of this Model
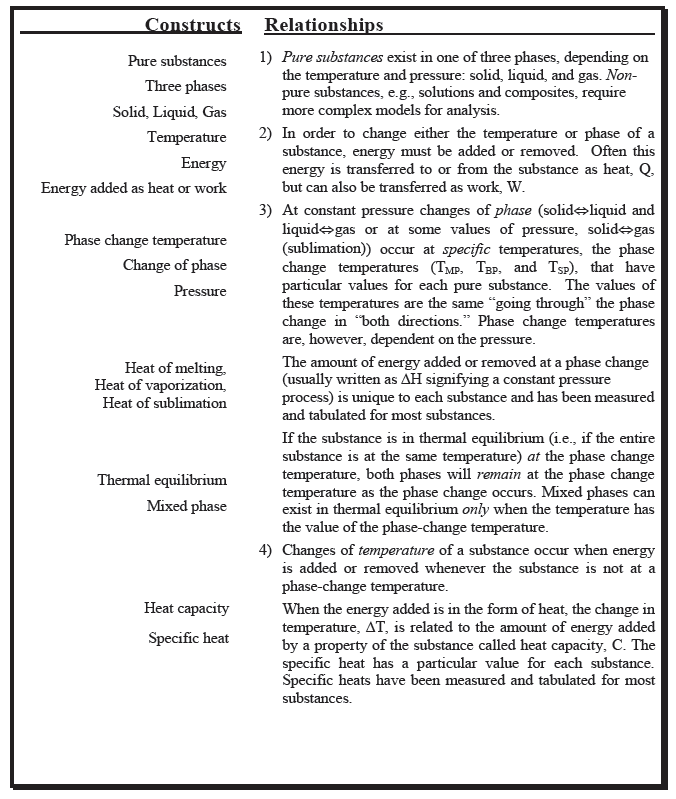
Pure substances
We adopt the standard chemistry definition that a substance is any material with a definite chemical composition. By “pure,” we simply mean that only one chemical substance is present in the sample.
Three phases
We use the common phrase “three phases” to refer to the solid, liquid, and vapor/gas phases of pure substances. We avoid the alternative phrase, “states of matter,” to avoid confusion with “thermodynamic state.”
Solid, Liquid, Vapor/Gas
These three primary phases have the meanings you learned in physical science and introductory chemistry courses. Resistance to deformation and to changes of volume characterizes solids. Resistance to changes of volume characterizes liquids, but the shape of liquids is determined by the shape of the container holding the liquid. If the container is not full, there will generally be a surface that does not touch the container. Gases expand to totally fill whatever space they occupy. Gases and liquids are frequently called fluids, because they can both flow.
Temperature
Temperature will take on a deeper meaning as we encounter models pertaining to the particle nature of matter. For this model, we need only the common meaning typically taught in introductory physical science courses. We do not yet invoke a particle model definition of temperature. At the simplest level, temperature is a measure of the hotness of something. Temperature is measured with thermometers of various types. Different temperature scales are related by universal agreement on the values representing certain easily reproduced temperatures based on simple physical processes. The temperature scales commonly used in the United States are the thermodynamic or Kelvin scale, the Celsius scale and the Fahrenheit scale. By convention, temperatures on the Celsius and Fahrenheit scale are written with the “degree” symbol followed by an uppercase “C” or “F.” However, with the Kelvin scale, in which the kelvin (note the lowercase “k”) is the SI unit of temperature, a temperature value is written simply as a numeral followed by an uppercase “K.” For example, the termperature at which water boils at one atmosphere of pressure is written as 273 K, 100 ˚C, or 212 ˚F.
The Kelvin temperature scale (sometimes called the thermodynamic scale) has the value zero at the “absolute zero” of temperature. It should always be used when the value of the zero of temperature matters. It is also very helpful to remember that the size of the kelvin is the same as the size of the Celsius degree.
Energy added as heat or work
At this point in our model development, energy is “something,” although not a material thing, that can be transferred to or removed from objects as heat or work. Energy can be transferred from one object to another as heat if one object is at a higher temperature (hotter) than the other. The transfer of energy as work involves one object pushing or pulling another object through a distance in the direction of the push or pull. (Note: We will frequently use the word “object” in a general sense to mean any material thing; thus, an “object” could be a solid, a liquid, or even a gas .)
Phase change temperature and change of phase
Phase change temperature is the unique temperature at which a pure substance changes from one phase to another phase. These temperature values depend on the pressure, but if a value for the pressure is not specified, it is assumed to be one atmosphere. Most (but not all) substances are solids at a standard pressure of one atmosphere and at sufficiently low temperature. As energy is added as heat, the substance changes from a solid to a liquid at a specific fixed temperature that is unique to that particular substance, and then as heat is continually added, the substance eventually changes from a liquid to a gas at a higher fixed temperature. These fixed temperatures are referred to as the phase change temperatures. A few substances at a standard atmosphere do not pass through a liquid phase, but instead change directly from a solid to a gas, referred to as sublimation. Carbon dioxide is a common example of this phenomenon.
In the simplest form of the Three-Phase Model of Matter, the phase changes occur at the same temperature “on the way down” as “on the way up.” That is, the temperature of the change from liquid to solid as energy is removed is the same as the temperature of the phase change from solid to liquid as energy is added. Due to this symmetry within this model, the liquid-solid or solid-liquid phase change temperature can be referred to as either the freezing or melting temperature. Likewise at the boiling point, the phase change temperature can be referred to as the boiling or condensation temperature.
Real substances can sometimes exhibit observable deviations from the symmetry mentioned in the preceeding paragraph. The size of the deviations depend on experimental factors such as purity of the substance and features of the surface in contact with the substance. This simple version of the Three-Phase Model of Matter can be modified to account for the more detailed behavior of a particular substance when desired. These modifications are explored in a discussion/lab activity.
Heats of melting, vaporization, and sublimation
Thermal equilibrium
Thermal equilibrium means that the entire substance is at a single temperature. During a process, the temperature of one part of a substance or object or system can be at a different temperature than another part. When the temperature is not the same throughout the substance or object, energy will be transferred internally as heat in the direction to cause the system to come to the same temperature. An isolated system will eventually reach thermal equilibrium to as close as we wish to define it.
Mixed phase
If a substance is in thermal equilibrium and is at a phase change temperature, part of the substance can be in one phase, perhaps a liquid, and another part can be in an adjacent phase, perhaps a solid. A totally isolated substance can continue to exist in a mixed phase forever if it is at a phase change temperature.
Heat capacity
At temperatures between the phase change temperatures, when energy is added to a substance, the substance increases in temperature. The heat capacity of a substance is a measure of the amount of energy that must be added to increase the temperature of the substance a certain amount. The larger the heat capacity, the larger the amount of energy that must be added to achieve the same increase in temperature.
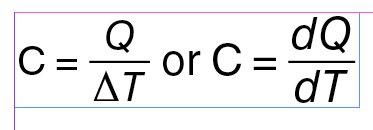
Heat capacity of a specific sample of matter is determined experimentally as the ratio of the amount of energy added as heat to the sample to the change in temperature of the sample. You probably recall from chemistry that there is often a subscript “p” or “v” attached to experimentally determined values of heat capacity, as in Cp and Cv. The subscript “p” means the measurement was carried out at constant pressure and the “v” means it was carried out at constant volume. There is very little difference between Cp and Cv in the liquid and solid phase, but there is a large difference in the gas phase, which we make sense of using the Introductory Thermodynamic Model.
If energy is added to a substance or object as heat and if there are no phase changes, then the energy transferred to the physical system as heat goes into changing the temperature, and the heat capacity is simply the amount of energy transferred, i.e., the heat, divided by the change in temperature:
Heat capacity is an extensive property. That is, it depends on the amount of substance: if you double the amount of substance, then the value of the heat capacity doubles. Specific heat capacity, or simply specific heat as it is commonly called, is an intensive property. An intensive property of a substance does not depend on the amount of substance. The two most widely used intensive expressions for heat capacity are specific heat per unit mass and specific heat per mole, or molar specific heat.
The SI units of heat capacity and specific heat:
Meaning of the Model Relationships
(Numbers below correspond to the numbered relationships on the Model Summary.)
- Pure substances exist in one of three phases, depending on the temperature: solid, liquid, or gas.
The statement above is the simplest statement that can be made regarding ordinary matter at one atmosphere of pressure. It captures the behavior of the vast majority of pure substances. Mixtures or composites, which are composed of more than one kind of pure substance will often behave differently as the temperature changes, because one component can begin to change phase or even decompose chemically, before the other component reaches the next phase change temperature.
The following information in this paragraph is interesting to know, but is not important in terms of the understanding the model. The common exception to the statement that all substances exist in all three phases is CO2, which does not exist as a liquid at a pressure of one atmosphere, but does exist as a liquid at higher pressures. Solid carbon dioxide passes directly from the solid phase to the gas phase at its sublimation temperature when it is at one atmosphere of pressure. Another exception is the common isotope of the element helium, which does not exist as a solid, even if it is cooled to as close to the absolute zero of temperature as we wish to define zero. At one atmosphere it remains a liquid, albeit, a very strange liquid, called a superfluid, all the way down to absolute zero. - In order to change either the temperature or phase of a substance, energy must be added or removed. Often this energy is transferred to or from the substance as heat, Q, but can also be transferred as work, W.
The first relationship, discussed above, could be interpreted simply as a common data pattern that is observed for pure substances. The model part really comes into its own with this second and the following third and fourth relationships. This second relationship “establishes a reason” for why substances don’t just willy-nilly change their temperature or change their phase. Neither can happen unless energy is added or removed. - Changes of phase (solid↔liquid and liquid↔gas or at some values of pressure, solid↔gas occur at specific temperatures, the phase change temperatures (TMP, TBP, and TSP), which have particular values for each pure substance. The values of these temperatures are the same “going through” the phase change in “both directions.” Phase change temperatures are, however, dependent on the pressure.
The amount of energy added or removed at a phase change (usually written as ∆H to signify constant pressure) is unique to each substance and has been measured for most substances.
If the substance is in thermal equilibrium (i.e., if all of the substance is at the same temperature) at the phase change temperature, both phases will remain at the phase change temperature as the phase change occurs. Mixed phases can exist in thermal equilibrium only when the temperature has the value of the phase-change temperature.
There is a lot of meaning packed into the three parts of this third relationship. There is something unique about each kind of substance that determines how much energy is required to cause the substance to change phase. Also, in this simple model, the amount of change in energy is the same (except for the algebraic sign) whether you go through the phase transition by adding energy or by removing energy. Finally, there is a lot of meaning packed into the last part of the statement regarding when and under exactly what circumstances two phases can co-exist without one turning into the other. Think about your cold soft drink about half filled with ice and half filled with cola. If there is sufficient ice when the warmer cola is put in, and if the drink is in a well-insulated container, some ice does melt, but then the cola and ice seem to peacefully co-exist for quite some time. According to this relationship, this can only happen if what condition holds? Only if both phases are at the phase-change temperature. Additionally, this last part of the relationship tells us what must happen if energy is added sufficiently slowly so that the system is nearly in thermal equilibrium. What happens to the temperature when energy is slowly added to the mixed phase? The temperature remains at the phase change temperature until all of the substance has changed phase. When you seriously think about it, this is kind of weird. Normally, when we heat something, the temperature rises. But in this special case of mixed phases, the temperature does not rise. There is much predictive power in this last relationship. - Changes of temperature of a substance occur when energy is added or removed whenever the substance is not at a phase-change temperature.
This last relationship tells us what we are already familiar with. When you add energy, the temperature of the substance goes up. When the energy added is in the form of heat, the change in temperature, ∆T, is related to the amount of energy added by a property of the substance called heat capacity, C, that has a particular value for each substance. Heat capacities have been measured for most substances.
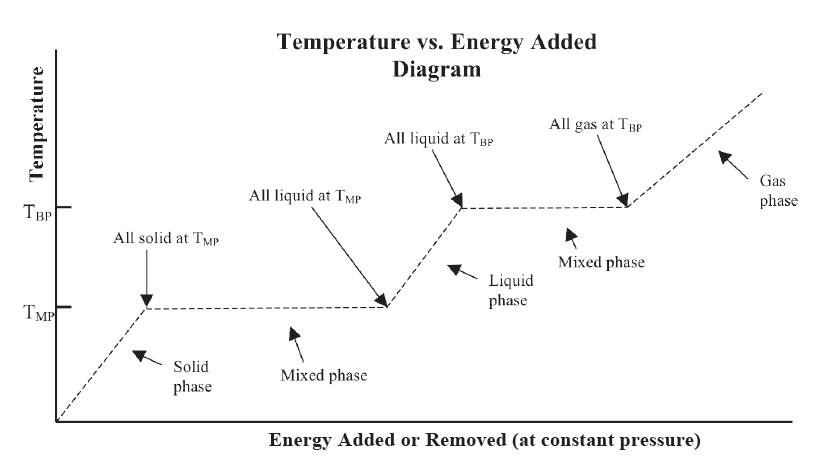
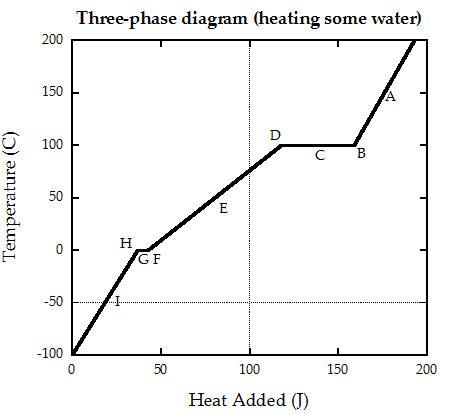
Graphical Relationship of the Three-Phase Model
The graphical representation shown on the Model Summary compactly summarizes all of the relationships of the model. It is very easy to be lulled into thinking this all makes sense, however, without actually digging into the meaning. You need to ask questions like, what exactly is the meaning of the horizontal portions of the graph. Can you explain in you own words “what is going on” physically in your ice cola drink during a horizontal portion of the graph? Which horizontal portion would correspond to your cold drink? What about the three slanted portions of the graph? What exactly is happening there? Where did the ice start out when you first put it into your cup? When was your drink system in thermal equilibrium, or was it ever in thermal equilibrium?
Can you picture what is happening in terms of this representation when you boil water to make tea? How is this different from putting ice trays into the freezer compartment of your refrigerator? How do the algebraic relationships relate to the graph? Which parts? What is the relationship? These are the kinds of questions you need to be asking yourself and getting confident about. You want to practice using this representation enough so that it really does become a useful tool to make sense of thermal phenomena and to be comfortable using it to construct explanations for particular phenomena.
2.1 Videos
Three Phases Video from Hayden-McNeil on Vimeo.
Check Your Understanding of the Basics
Question Practice Question 1
24pRLf4zOM0t/oA0GWa8RL8AzMh9MlZv+afs5/GBPCkyUtaC4OzUMBTsFzS0vdbsBAQpS4Y9zaR48sNIkk58p1n2mP8rt0ZI90kB6qafdW6iHYeJgWs4eeZNse1pFQTdlCno5GIyP6Ssyw3VriNJScmAkNOMB/JI0Cd3yiW7Edx53LsvS2SGIgMVev1UvboifTDg4ZPOQRH1Sc+LaIuZX7ag066e0sqs/gEYmD+gh0xRDFc5
Question Practice Question 2
K+PkJnM/JurkqDQwPf5bs/5nkGhbnIZMXWO6D5rGPxBsXfVxx6zq8j1w6qZRSMYp1WBVqkz6/LElq6V8NkKI6MS8SHZhyAQ34OhGfY3xYgNryjJ16at09/cn3Qsyaw46Q+tUCXyup/WLzQfGG83BAu8KMtAER2VBgQTmFEKqoOk2Yi8RkQD8M47d9gIu91tc9+YFqkVj2jj0ZDR1v10vGOAoCUyJgl4TK3sY2WjxY5U0fVjfpgQAEBwH8cM=
Question Practice Question 3
i4GHO0jnkQCzLVUjmsQpBhaDHfPt+xfuoHBrixierRN3Ymf++x5eU7GhYNb1xoGSmgl0ln/tAb+PCYCHnuVfk9lRqIrdTDALfv8s5assVFvC4W1s70TYHsWTK+n7BWvjN6lWDdrK7dakilVaNFhLs1OgDShYcQZMLp7p66/nBsD6YpLB+sSCnpzMVag/I640HG6VUcNHkSg+3qENKN8Xkps5ko4MmppEL40OqlPS61bxywHcKZSPfTJ71OfoIUUwgjRB+aIw5ZC2cPWcaIv0Tv1xI0yRsVBK5LdEdC14Bz8g9PHE3toiY8hTv1IZbttmX5RTQh4dFzAzSVv3s6eEtq8e4fDAWn1PR9ucQugXEAA0mBRTjRR1NW9WpjqyQWuBVhvsu4+kpQQnPBoHBT7sGTJqcWLKkGWteS3vPm9kaggVqNixFtRYEzW7v4Fzy/BtoazZ+CivIyHyq+lKYvHrD1XpAATdfauv3TmNMA==
Question Practice Question 4
tpHdzy7kcSu0/FcDhjN1aKUMiJi1aVlbpnbNeleNGEjzJUO1Et7KQjsL1ja+sj2qMBsk3ICG3mC6mdJwu7ZCvu0vibF8I9jSHY8oVF70Grqlag5nBrgeZYleFU4wY5oT8CNuPZ8vIoRw8AGYaiHRCDqWWXfdBSPFx50gwjCGYM7x62xPr3aFvCVkjyiQpfCi/6nhMzEOL1Q7mjf0DnWjSXmHDAsqdelst4sxDF03IK4Cg+XA3S8T0+HBOm5D/w5TSyOQQJ05avIjpW3zwVbei08VqNKeyJCCe4VfRMVQwMsC3nLb+3ssz5UxAJUmmNRmowWSF2OTOxaqV/nbd4iCvIG2iAMNXMMHh1NSx1l9sOblIXUg/LHGPH9RxAMCWqDN5EYO0yiHUdcX3nJC8Tiv94WEOgjnz+cWGzG8zLQIzBPdt9VNC+7Zud1N3/oDh5XG8nw/QIeJ4Q2fvhPQM1c9j+DkDy1GnD2SsPBCzx2BavUnIwJ3gxnys2hOFHl4/WpTlZvBGOD9mOfDSeeSKBCNi/e/JH/IF0hhEidrkGrvwe/ID+k27sr3CD00fT7fQ/RttcsT9e93qeuIQn3XUwajwUNYKQXUBwU8zwYjOh80FvJ79vVnsLZCFb/rM11c5HS2/uDguO+tSBdMVq9YhGp9pGgG3YRdf5HbEVL9/kJnZLAx2FLGoXed8ujuikZA/13vGhU9c9Vro1EXfjj5ZUzTQIa5ypnnZ60FhxAte2XRdBkZNBQXo5qJbvU1UzYW2oeyA663hKX8I9ZUaoS/s26NUcS+6EiBhgeuqw9SAKJJloZdipq5eBRefCg1ZJzx0TlI3Q/hBxT+pGguxd0ncRLJL0ijytuE+yITJV6o5GcBg+wiVfPOB3FlMIb2b+AwLo45lezbqDkbL45/5SEfzKyijlPmgA4XUlw3ZV874o9/NPedOaFXGHAVdvPYV0kkAH/juRWsQuag+1eZQYD/Aqh/drGhtbs9sZFBzGg1gd3GQ6JLSGfvwz1rF3atZTcXxmCyLF+fL502lisUdHI+L1HfwBV7c0G/OB+I7J18aq7GTvYncxd8P1ksXo76IUIyRFJk4ocKFvc/Xz+ksG4RISUsj11iYeKLK1I1GnCKinwhgQCu9LOijWJiosjT7Dok8gGgQlLhHa29hnIZOW4n9uYNIP3Q02bVdJp1F6LBvbGPWdlKeTXapRXMju8eRyrxgqoI4qUUZcuDOBWzctuIBRcb4hVbFQt2Sub1CTvUUlnFgdlrIDw0u3RjeelQ7OXy4/F0dKCljtDDzGXRqv1fNKZIGKY1BqpLflbc3oNIqNNGP6us7GbtmV4haT5+3cBpQA1SoY+/sg9GN/rkGO+9FA9eMhCgzpsFsjlGJRzTtKog8v/QVH4dWwY6LgZxr95L/Tj7