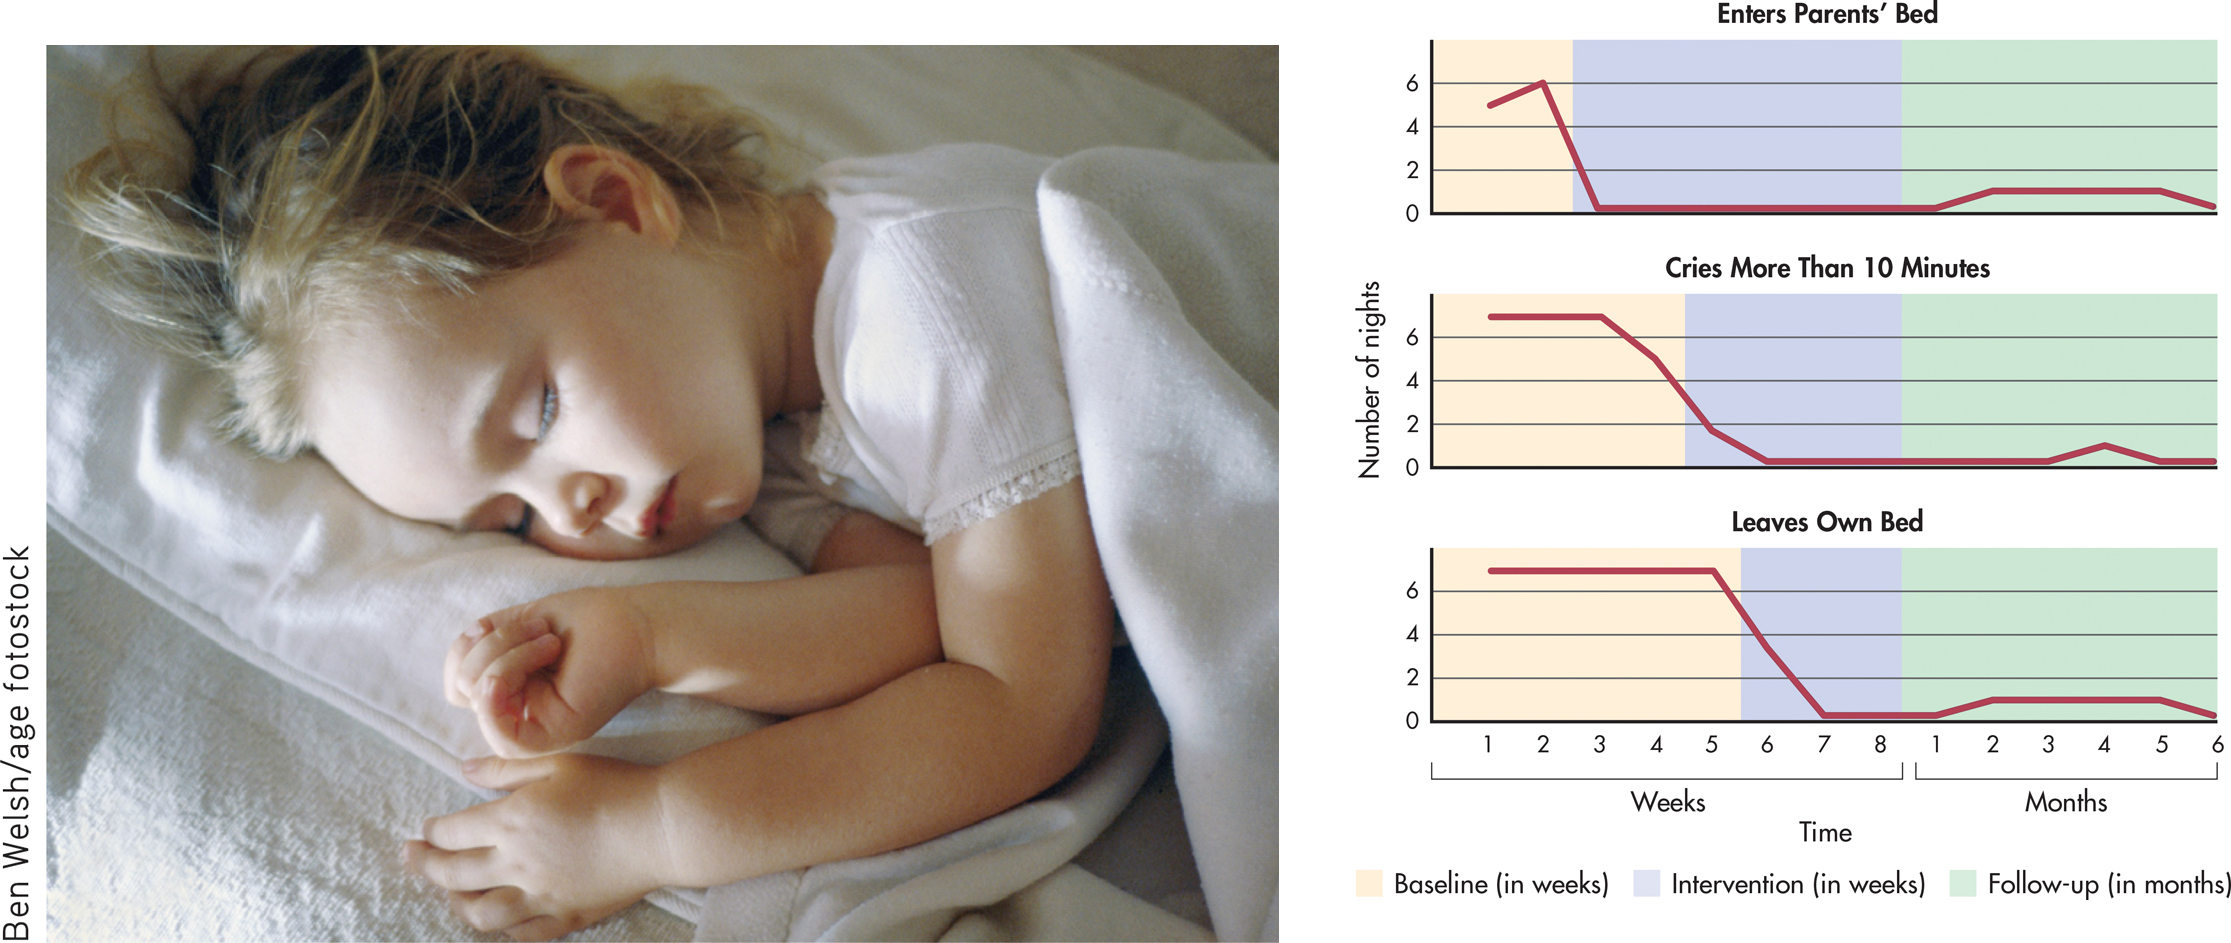
FIGURE 15.2 The Effect of Operant Conditioning Techniques These graphs depict the changes in three specific sleep-related problem behaviors of a 4-year-old girl over the course of behavioral therapy. The intervention for each problem behavior was introduced separately over several weeks. As you can see, behavior therapy produced a rapid reduction in the rate of each problem behavior. The green area shows the maintenance of desired behavior changes over a six-month follow-up.
Source: Data from Ronen (1991).
Ben Welsh/age fotostock
Ben Welsh/age fotostock