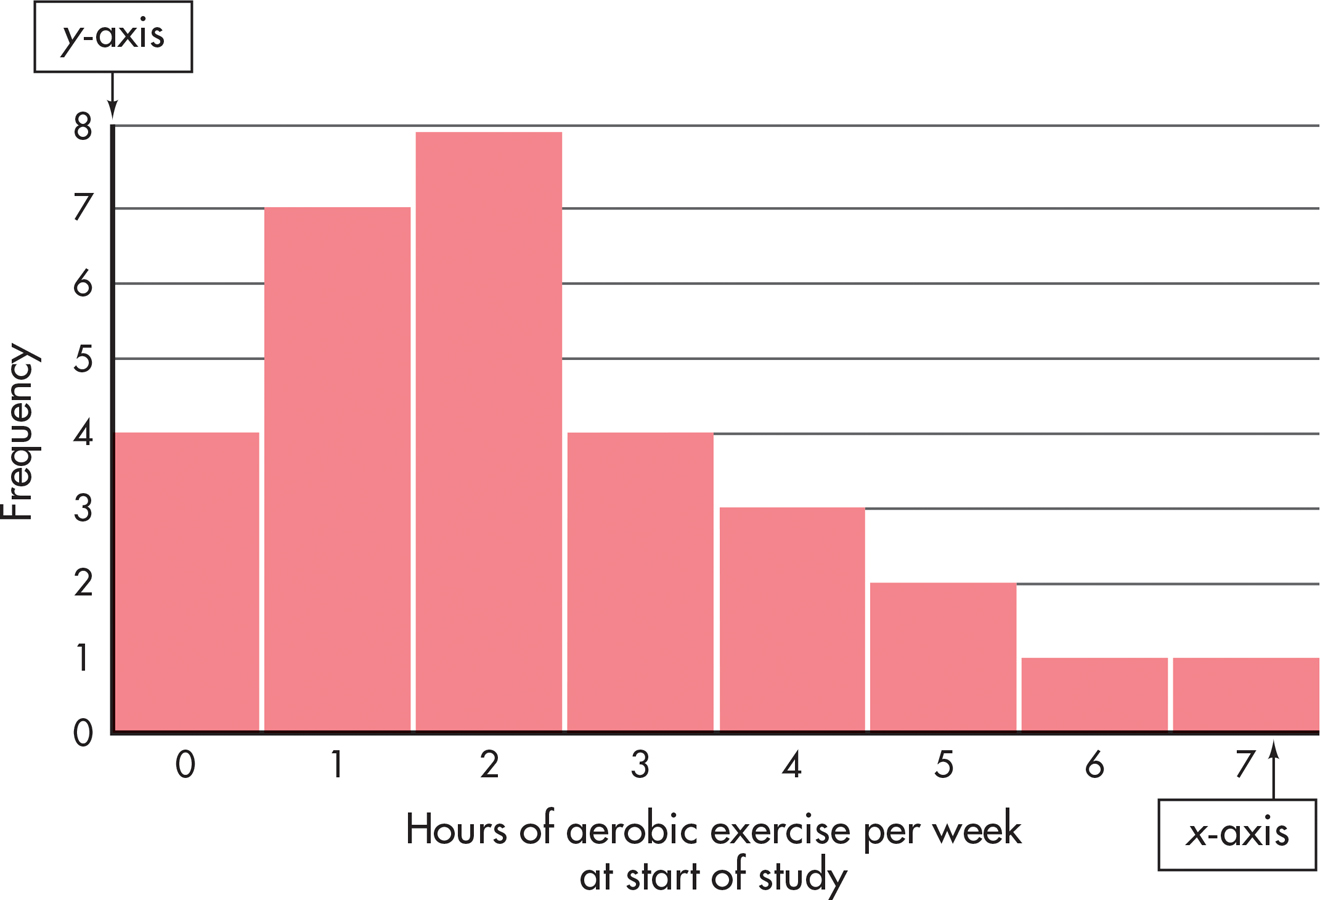
FIGURE A.1 A Histogram This histogram is another way of presenting the data given in Table A.1. Like the table, the histogram shows that most people do, at best, only a moderate amount of aerobic exercise (two hours or less each week). This is immediately clear from the fact that the highest bars on the chart are on the left, where the hours of exercise are lowest.