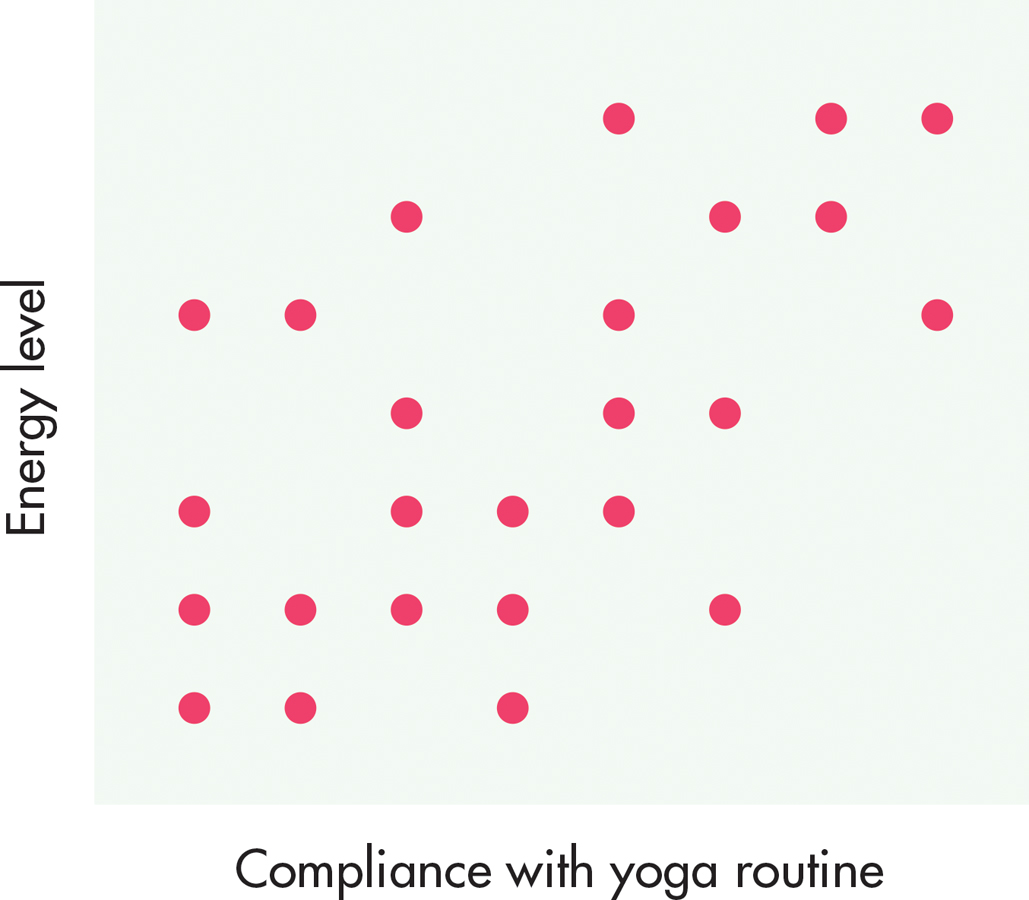
FIGURE A.6 Scatter Plot of a Positive Correlation A correlation (or the lack of one) can be clearly shown on a scatter plot. This one shows a moderately strong positive correlation between subjects’ compliance with the yoga component of the alternative health-promotion program and their energy level. The positive direction of the correlation is indicated by the upward-sloping pattern of the dots, from bottom left to top right. This means that if one variable is high, the other tends to be high, too, and vice versa. That the strength of the relationship is only moderate is indicated by the fact that the data points (each indicating an individual subject’s score) are not all positioned along a straight diagonal line.