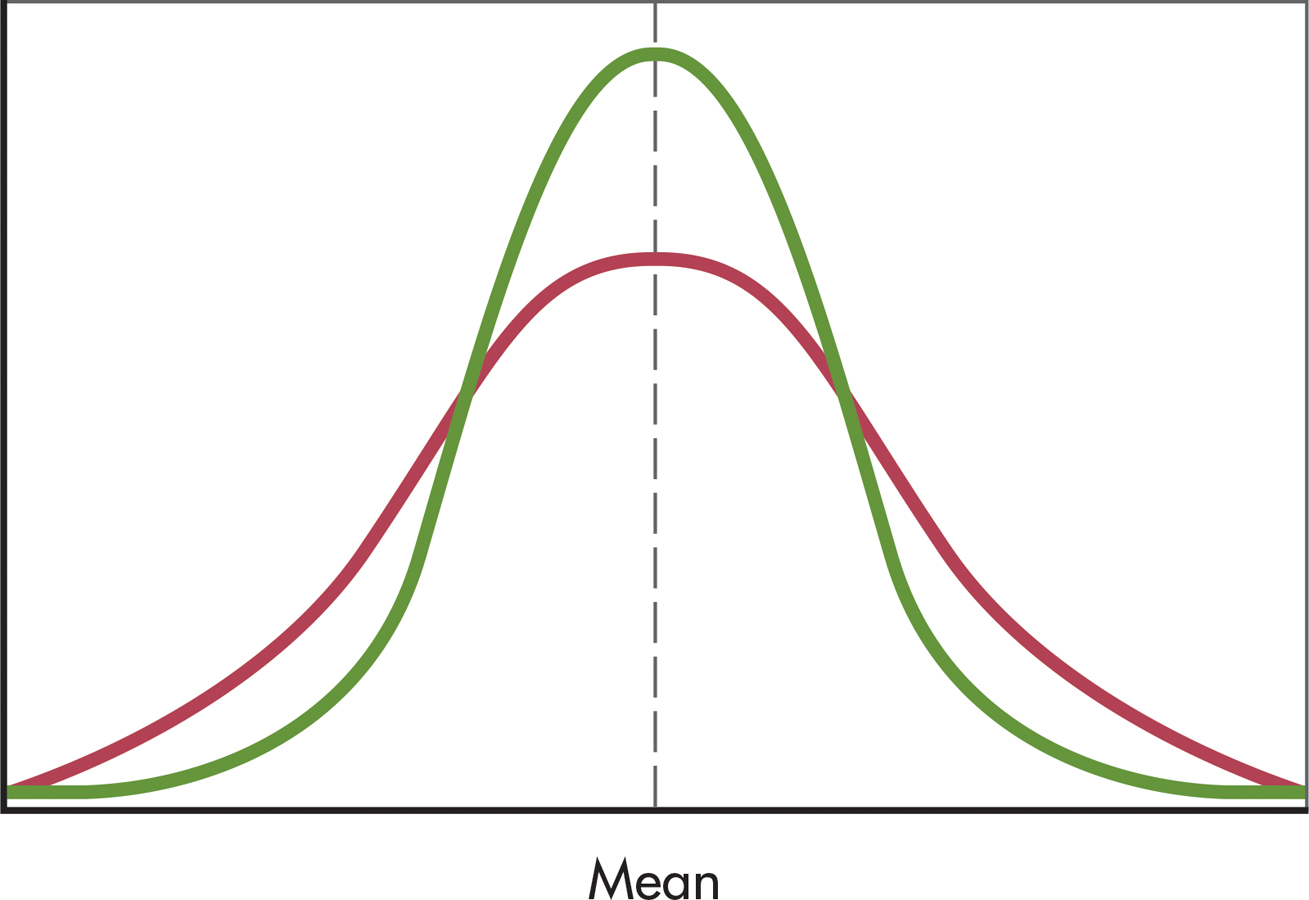
FIGURE A.4 Distributions with Different Variability Two distributions with the same mean can have very different variability, or spread, as shown in these two curves. Notice how one is more spread out than the other; its scores are distributed more widely.