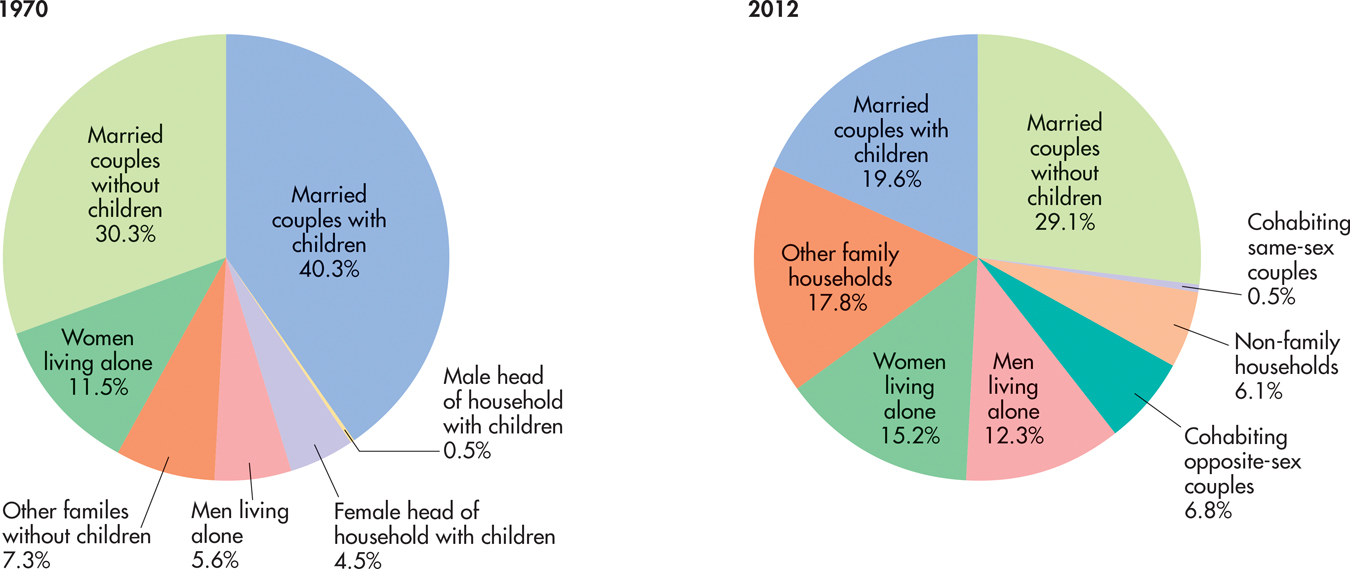
FIGURE 9.6 The Changing Structure of American Families and Households In a relatively short time, American households have undergone a metamorphosis. Between 1970 and 2012, the number of American households increased from 63 million to 115 million, but the average household size decreased from 3.1 to 2.6 persons. As the living arrangements of American families have become more diversified, the U.S. Census Bureau modified the categories it uses to classify households. Hence, the two pie charts differ slightly. Notice that single-parent family groups have doubled. Today, single mothers or fathers represent 9 percent of all households. In contrast, the number of married couples with children has sharply decreased.
Sources: Data from Kreider, 2008; U.S. Census Bureau, 2008c, 2008d; Vespa & others, 2013.