Group 1: This group was shown news feeds with a reduced number of positive posts. That is, they were more likely to see negative posts like this one.
Myibean/Shutterstock
Think Like a Scientist
Contagious Online Emotions
By: Susan A. Nolan, Seton Hall University Sandra E. Hockenbury
FAQ
What is Think Like a Scientist?
Think Like a Scientist is a digital activity designed to help you develop your scientific thinking skills.
Each activity places you in a different, real-world scenario, asking you to think critically about a specific claim.
Can instructors track your progress in Think Like a Scientist?
Scores from the five-question assessments at the end of each activity can be reported to your instructor. To ensure your privacy while participating in non-assessment features, which can include pseudoscientific quizzes or games, no other
student response is saved or reported.
How is Think Like a Scientist aligned with the APA Guidelines 2.0?
The American Psychological Association’s “Guidelines for the Undergraduate
Psychology Major” provides a set of learning goals for students. Think Like a Scientist addresses several of these goals, although it is specifically designed to develop skills from APA Goal 2: Scientific Inquiry and Critical Thinking.
“Contagious Online Emotions” covers many outcomes, including:
REFERENCES
Berreby, David. (2017). Click to agree with what? No one reads terms of service, studies confirm. The Guardian. Retrieved from https://www.theguardian.com/technology/2017/mar/03/terms-of-service-online-contracts-fine-print
Chaffey, Dave. (2017). Global social media research summary 2017. Smart Insights. Retrieved from http://www.smartinsights.com/social-media-marketing/social-media-strategy/new-global-social-media-research/
Kramer, Adam D.; Guillory, Jamie E.; & Hancock, Jeffrey T. (2014). Experimental evidence of massive-scale emotional contagion through social networks. Proceedings of the National Academy of Sciences, 111, 8788-8790. doi:10.1073/pnas.1320040111.
This activity invites you to test the claim that your mood is influenced by emotions expressed in your social media news feeds. First, you’ll read through two sets of news feeds, considering what you would post in response. You will then examine evidence from a study that manipulated the emotional content of Facebook feeds. You’ll consider alternative explanations for the Facebook findings and you’ll look at the source of the Facebook data to understand differences in research performed by a for-profit company versus a university.
1.
Identify the Claim
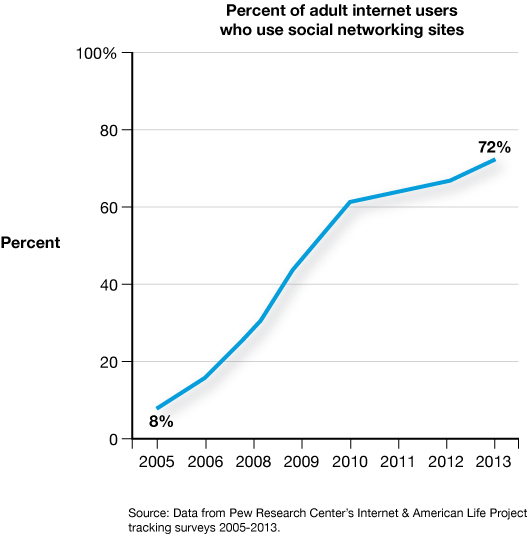
Do you use social media? Almost three billion people around the world now do (Chaffey, 2017). This graph shows a huge increase in use of social media by internet users over just one decade. About 20% of the time we spend online is on social media sites like Facebook or Twitter.
How are we influenced by the massive amounts of time many of us spend on social media? Does time spent online reduce our in-person interactions with friends and family? Do social media make us more open to new ideas? Are our moods influenced by the posts we read? Can we "catch" a happy mood or a sad mood through social media?
How could you find out if social media is affecting your mood? Many social media sites include a news feed that is continuously updated with posts from your contacts, so we’ll examine that.
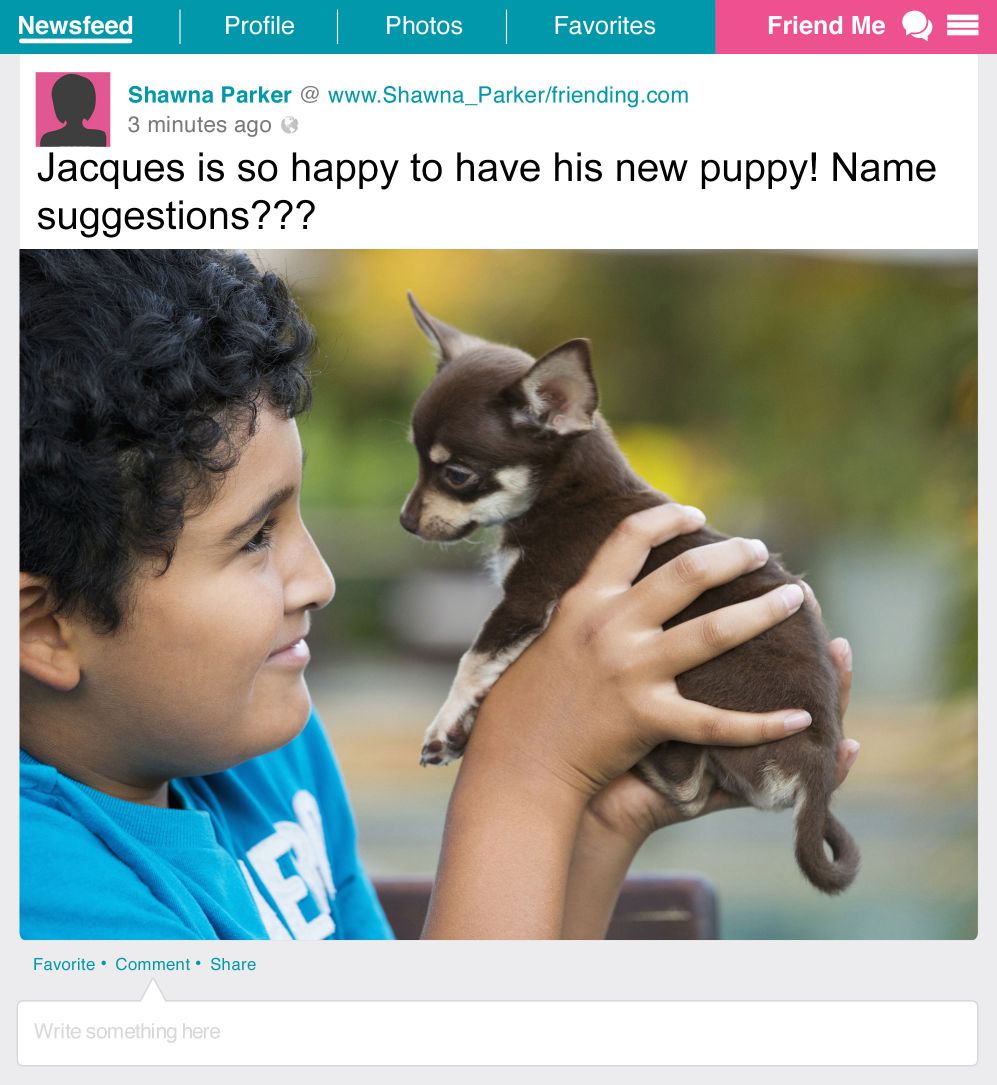
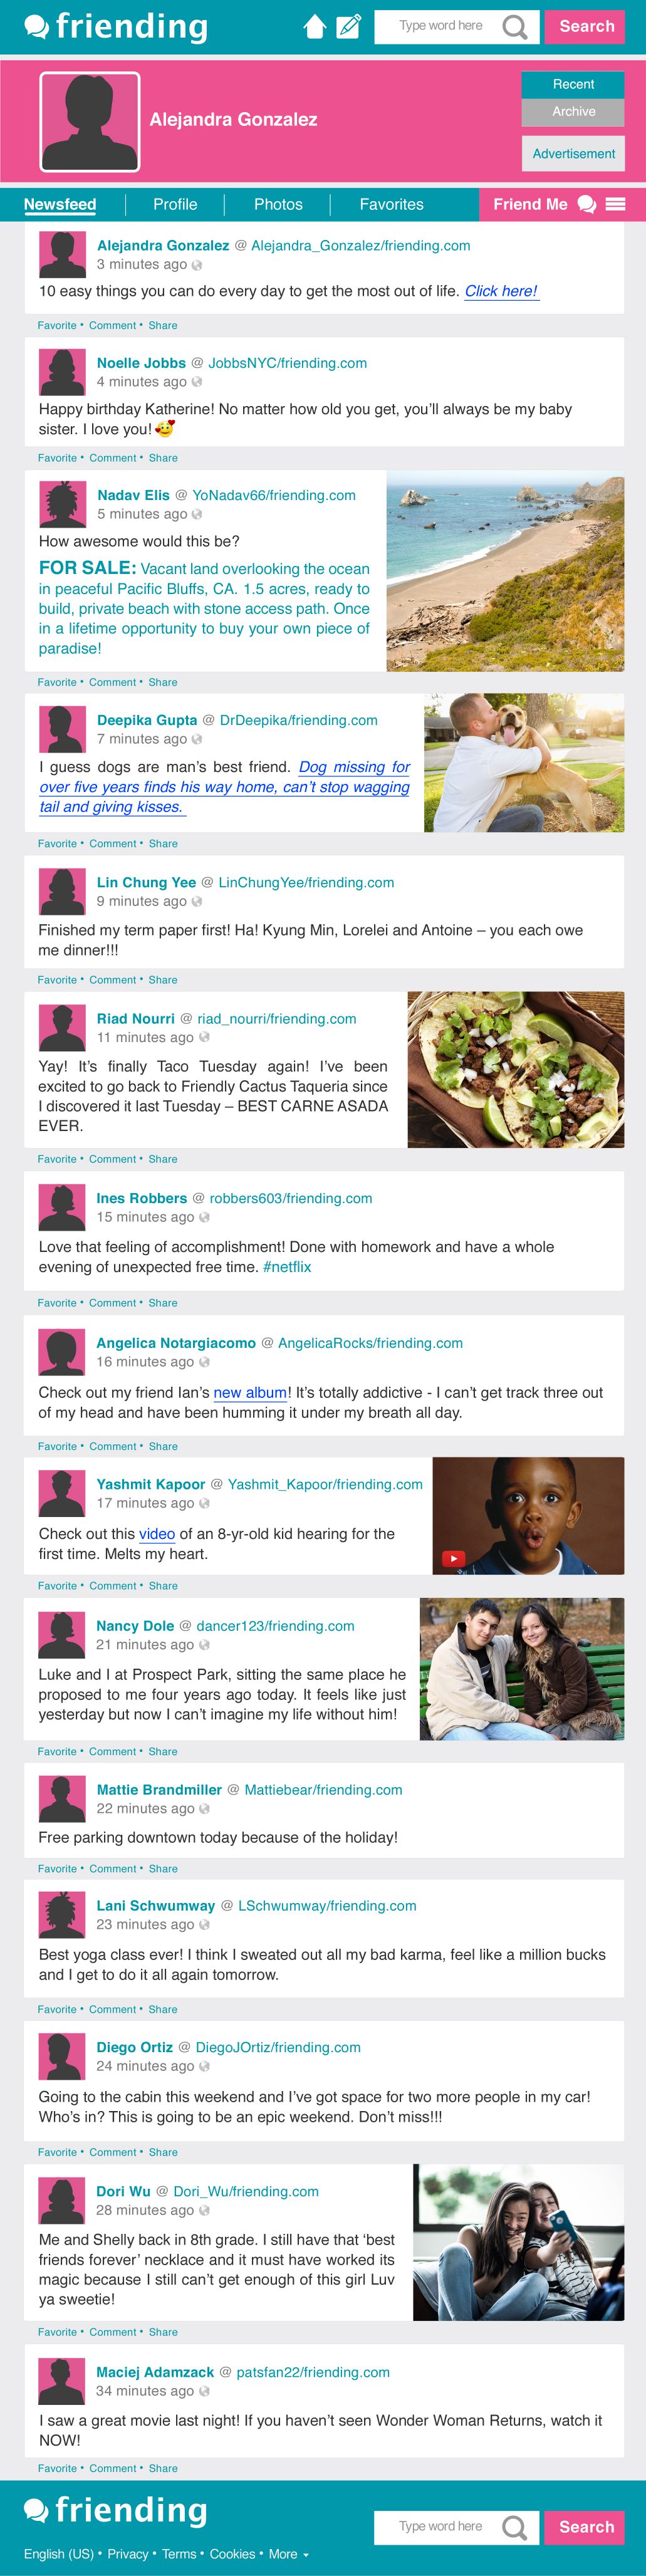
Pretend that you’re an avid user of the fictional social media site “Friending.” Here’s your news feed. (You can click the image to enlarge it. Note that links are not active.) Read through the news feed, and then consider what you would post about your day in light of what your friends are posting. At the end of this feed, you’ll be asked to write what you might post.
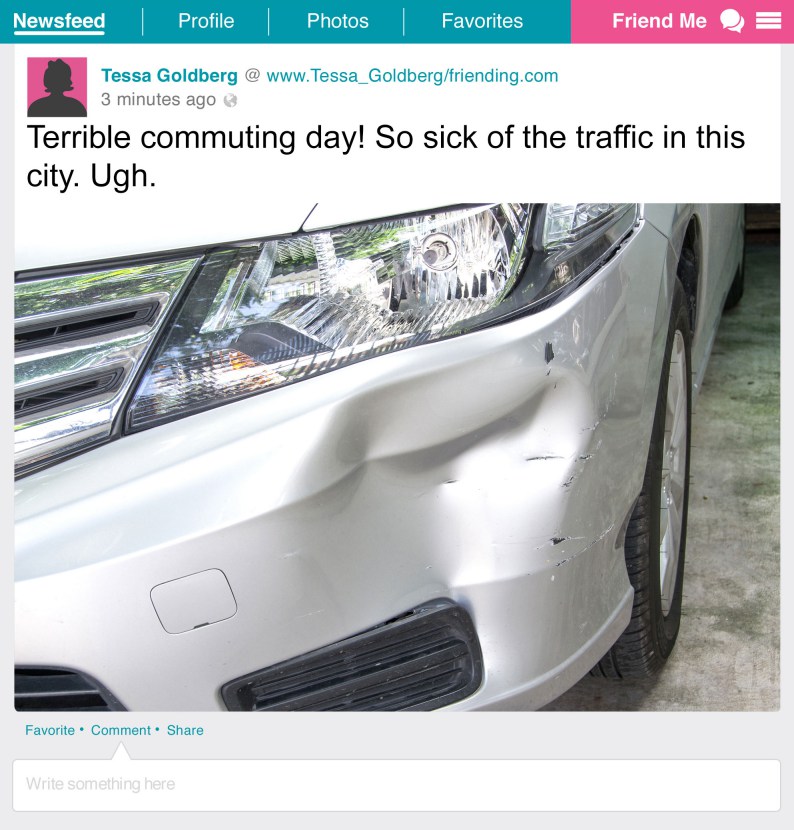
Now imagine that the following is your news feed on Friending. Read through it, and consider what you would post in light of what your friends are posting.
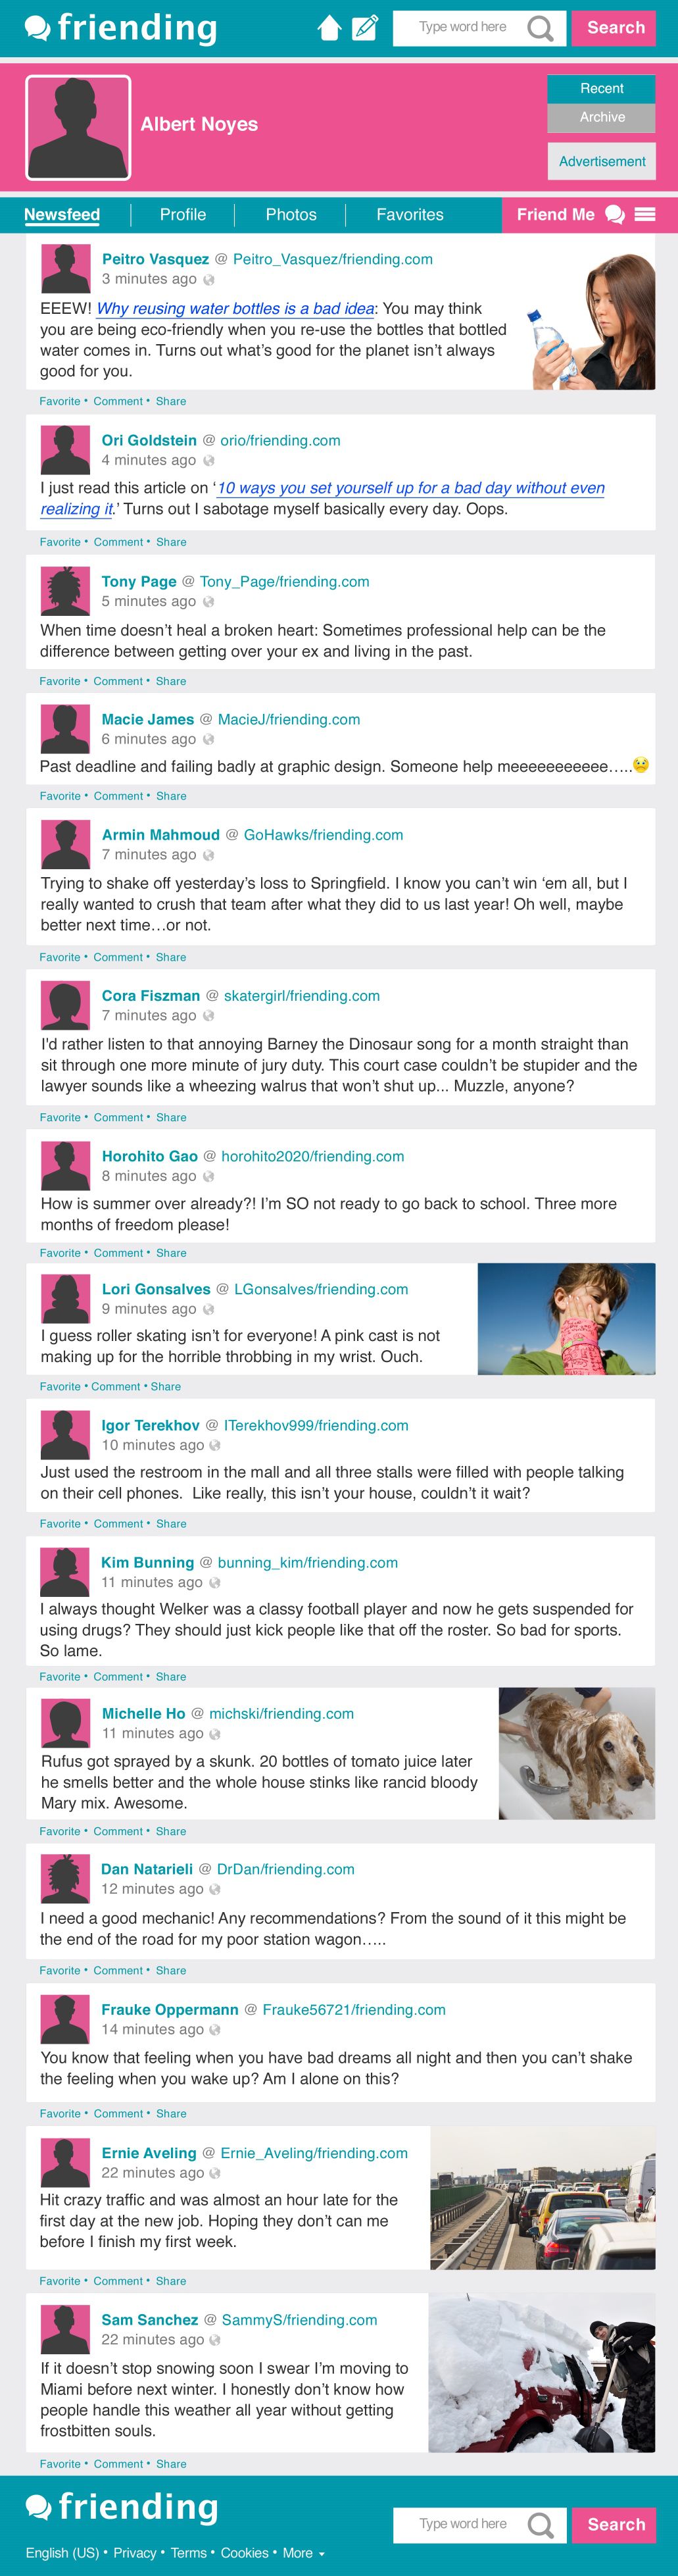
Did you notice a difference in the two fictional news feeds? The first news feed had only positive posts. The second news feed had only negative posts. Did this influence you?
Science often starts with an observation. A scientist notices something about people’s behavior and then comes up with a hypothesis related to that observation. Then, the scientist designs research to test that hypothesis. If you wanted to study whether social media can influence your mood, what might your hypothesis —the claim—be?
2.
Evaluate the Evidence
Our hypothesis—that a news feed can influence our mood—has already been tested. The textbook chapter on research methods tells us that we can only identify a cause of behavior if we conduct an experiment. In fact, a team of researchers that included Facebook scientists performed an experiment to test a hypothesis similar to ours—that Facebook news feeds affect people’s moods.
The Facebook study was more subtle than the fictional demonstration you just participated in. We had you look at a feed with all positive posts and then a second feed with all negative posts so you could easily imagine the effect that such a manipulation might have on your mood. In the Facebook study, participants looked at feeds with a reduced number of positive posts or negative posts.


How did the Facebook study work? Facebook users were randomly assigned to one of two groups. Random assignment is essential to an experiment because it makes sure that all groups are similar. With random assignment, research participants would be equally represented in Group 1 and Group 2.
Imagine you are participating in the Facebook study. Click to see which group you are randomly assigned to.
So, the independent variable was type of posts: more positive posts overall or more negative posts overall.
This study, then, meets the criteria for an experiment. It used random assignment, so everyone had an equal chance of ending up in Group 1 or Group 2. It then manipulated something—the independent variable (type of posts)—so that each group experienced something different. All that’s left is to measure an outcome—the dependent variable—so that we can compare Group 1 and Group 2.
Over one week in January 2012, researchers manipulated the news feeds of 689,003 Facebook users. (For reference, this is a HUGE sample size, likely among the largest experiments ever!) The researchers were able to include so many experimental subjects because the process was automated. The researchers did not have to evaluate individual news feeds themselves. Software measured the two dependent variables: the percentage of positive words and the percentage of negative words in each subject’s posts.
What did the researchers find? Facebook users who saw a higher percentage of negative posts wrote more negative posts themselves, and users who saw a higher percentage of positive posts wrote more positive posts themselves. Did you find yourself doing the same thing earlier in this activity? Here’s what you wrote earlier after you read the positive news feed:
New Paragraph
And here’s what you wrote earlier after you read the negative news feed:
New Paragraph
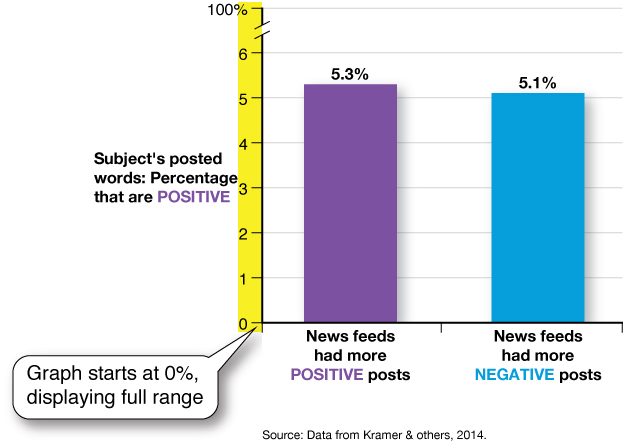
Evidence from the Facebook study supports the claim that news feeds affect our moods. The graph here, based on one in the published journal article, shows that subjects who saw more positive posts were more likely to include positive words in their own posts than were subjects who saw more negative posts. Is this what you did when faced with a positive or a negative news feed earlier in the activity?
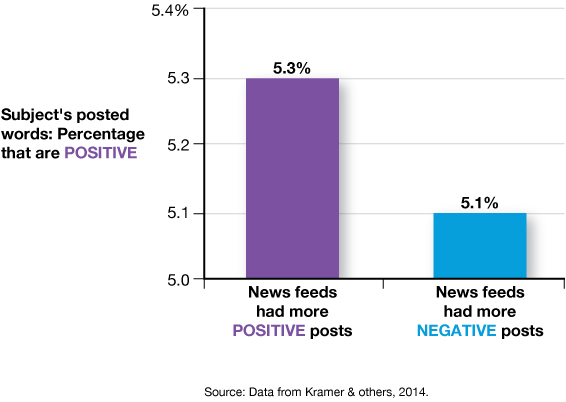
The researchers believe these results show that “emotional contagion occurs without direct interaction between people” (Kramer & others, 2014). That is, you don’t have to actually see or talk to someone to “catch” their mood. Facebook updates are enough!
3.
Consider Alternative Explanations
This study was an experiment, so we can conclude that one variable causes changes in another variable. But knowing that a causal link exists is not the same as knowing why a causal link exists. We have evidence that Facebook users tend to match the emotional tone of their news feeds. Does this mean they are “catching” their friends’ moods? Or are there alternative explanations?
Earlier, you wrote your own posts after reading a list of positive posts, and then after reading a list of negative posts. Why do you think you posted what you did? Were you aware of the positivity or negativity in the posts when you wrote your own? Do you think it influenced you? In this extreme situation, most people match the positivity or negativity of what is in the news feed, or at least stay neutral. Certainly, one reason is that your mood might actually shift depending on what you read.

Does this photo make you feel uncomfortable? It went viral because it combines two incongruous things—a happy person taking a selfie while a tragic event unfolds in the background. Placing a positive post in a negative environment is similar. It just seems inappropriate when your post doesn’t match the backdrop of other people’s unhappiness. When we see emotions that we perceive to be incongruous, it makes us feel uncomfortable. We are more comfortable matching the emotional tone of our environment.

However, the Facebook researchers protest that the changes they saw in their experiment were “not a simple case of mimicry” (Kramer & others, 2014). They point out, for example, that subjects who saw more positive posts did not just post more positive words. They actually posted both more positive words and fewer negative words. The researchers believe you would not see this pattern if people were simply mimicking what they saw. Sometimes it can be hard to separate competing explanations for a finding.
Thinking like a scientist also means evaluating whether a study’s findings matter in our everyday lives. Sometimes this means asking good questions about graphs and other visualizations of data. Let’s look again at this graph you saw earlier. On first glance, the difference between the groups appears very large. But look at the numbers on the vertical y axis, which are the same numbers used by the researchers in their published graph. The graph only shows the span from 5.0% to 5.4%.
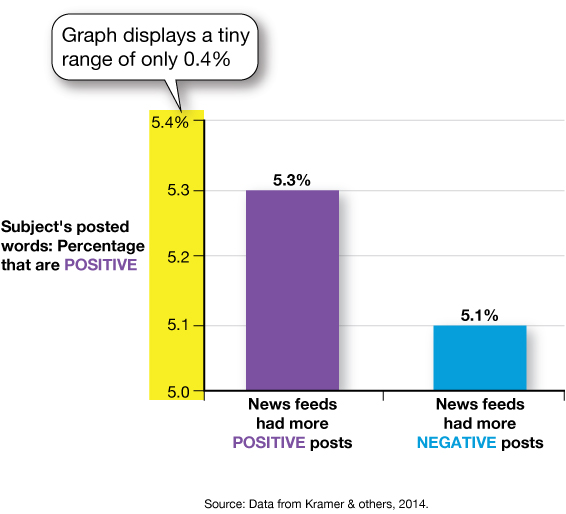
Graphs that limit the data in this way can mislead by exaggerating the difference between groups. Here’s a revision of that graph that starts at 0%. This makes it much more obvious that the difference between the groups is actually very tiny—5.3% versus 5.1% of words were positive in the two groups.
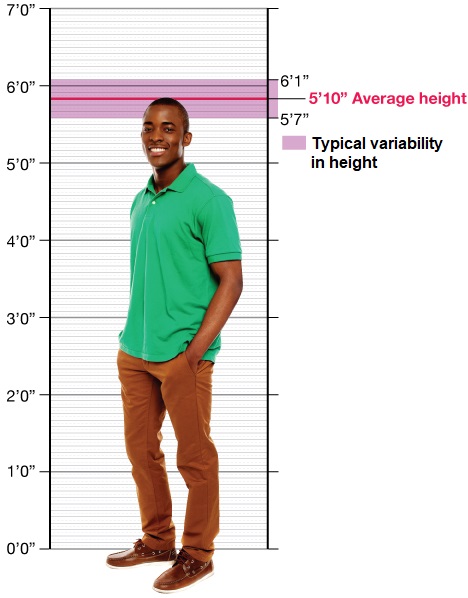
Just how small is the difference between the two groups in the Facebook study? To give you a sense, let’s think about it in another context. The average height for men is about 5’10”. The typical man varies from that height by three inches in either direction. Now imagine a change in height for a 5’10” man that is the same size as the change seen in the Facebook study. It would be unnoticeably tiny—just 0.003 inches! You couldn’t hold your fingers that far apart if you tried. In fact, it’s thinner than the thinnest line we could draw.
However, the researchers argue that their findings are meaningful despite the very small effect. Even a small effect, they point out, “at Facebook’s scale is not negligible: In early 2013, this would have corresponded to hundreds of thousands of emotion expressions in status updates per day” (Kramer & others, 2014). But you might still wonder whether this difference is meaningful for you.
4.
Consider the Source of the Research or Claim
Thinking like a scientist also involves thinking about the source of information. Most academic research is conducted at universities, hospitals, or other nonprofit organizations. But some research is conducted by for-profit organizations. For example, for-profit pharmaceutical companies like Pfizer and Johnson & Johnson routinely fund research on new medications. The Facebook study we discussed here is another example of research conducted by a for-profit organization.
Does the fact that Facebook, a highly profitable corporation, spearheaded this research make a difference? What questions should we ask ourselves when profit is intertwined with science? Many argue that it should not make a difference if, as in this case, the researchers are highly trained scientists and the results were published in a well-respected, peer-reviewed journal—that is, in a journal where other scientists have examined the work before approving its publication.

But sometimes there are significant differences when research is done for profit. One issue is that the research may not be subject to certain important policies, such as those related to obtaining the informed consent of participants and others related to how data are stored and shared.
Human research at universities and hospitals in the United States is subject to oversight by federally mandated Institutional Review Boards (IRBs) that ensure that these policies are in place and are followed. But the Facebook experiment was conducted at Facebook by their own scientists. Even though they worked with a researcher from Cornell University, the fact that it was conducted internally by Facebook meant that the Cornell University IRB decided that they did not have to sign off on the ethics of the experiment. Do you think Cornell should have done more?
Were you using Facebook in 2012? If yes, then you might have been an unwitting participant in this experiment. How do you feel knowing that your Facebook news feed may have been manipulated by researchers?
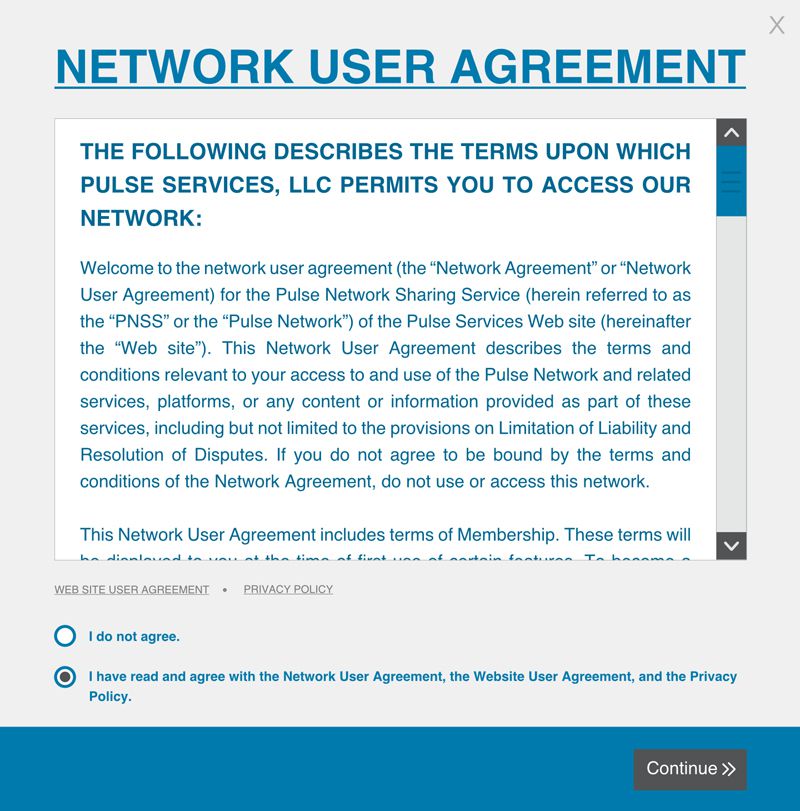
All Facebook users sign an agreement with Facebook’s Data Use Policy before setting up an account. The Facebook researchers observe that this constitutes informed consent for their research. But is it sufficient that informed consent is obtained through the fine print of a user agreement? The typical American would have to spend as many as 250 hours a year to read all of the user agreements encountered online (Berreby, 2017). How often do you actually scroll through and read entire user agreements, including the privacy policies?
Most of us don’t. But it’s a good idea at least to read the user agreements of the sites you use most. And be aware that you could be part of an experiment every time you go online.
5.
Assessment