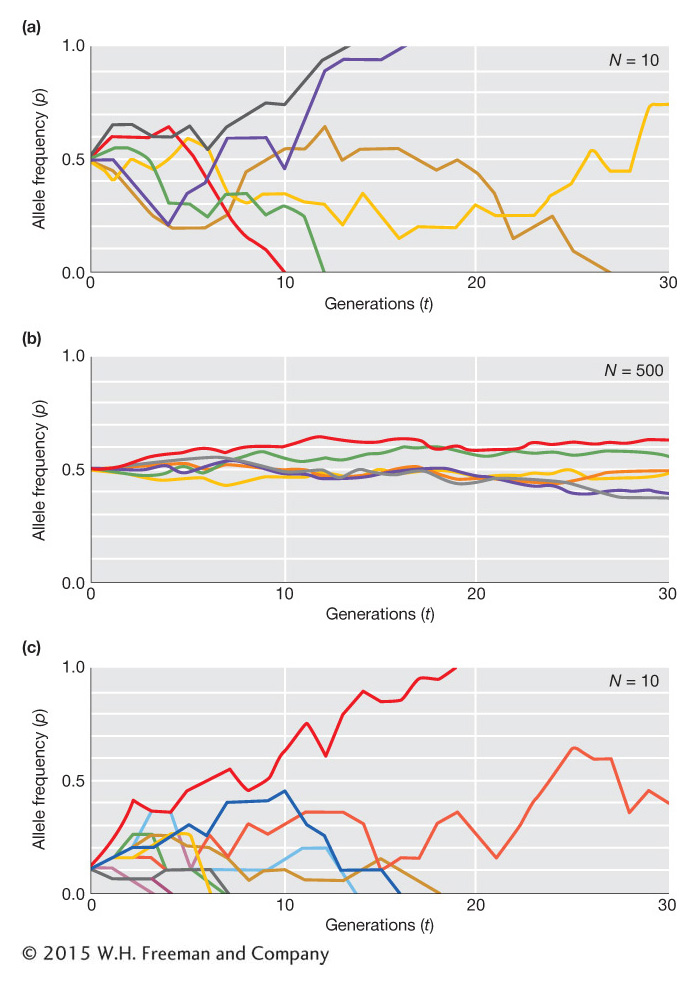
Random genetic drift is weakest in large populations
Computer simulations of random genetic drift. Each colored line represents a simulated population over 30 generations. (a) N = 10, p = q = 0.5. (b) N = 500, p = q = 0.5. (c) N = 10, p = 0.1, q = 0.9.