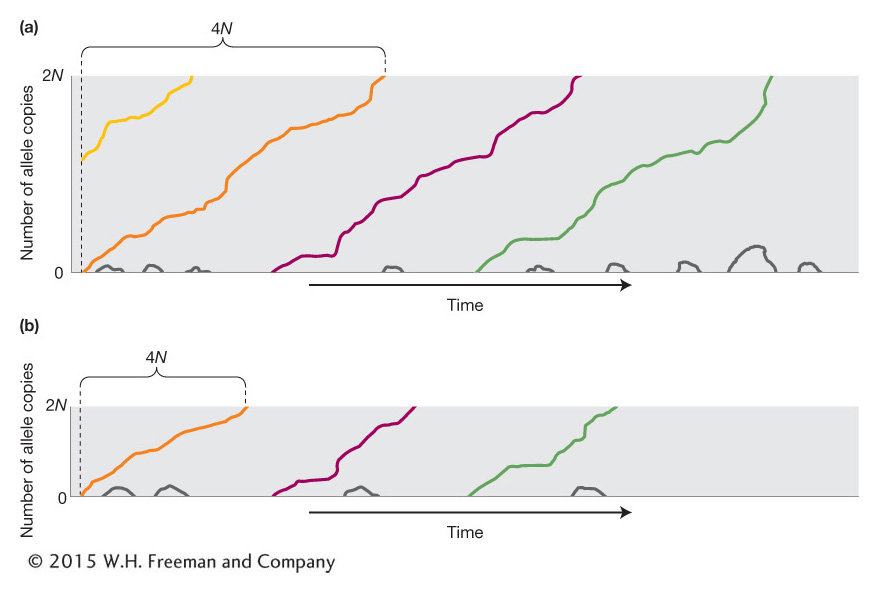
(a) Graphical representation of the appearance, loss, and eventual incorporation of new mutations in a population over time under the action of genetic drift. Gray lines show the fate of most new mutations, which appear and then are lost from the population within a few generations. Colored lines show the fate of the few “lucky” mutations that continue to rise in frequency until they reach fixation. (b) A population that is 1/2 the size of the population in part a. In this population, 4N generations is 1/2 as long and the lucky new mutations are fixed more rapidly.