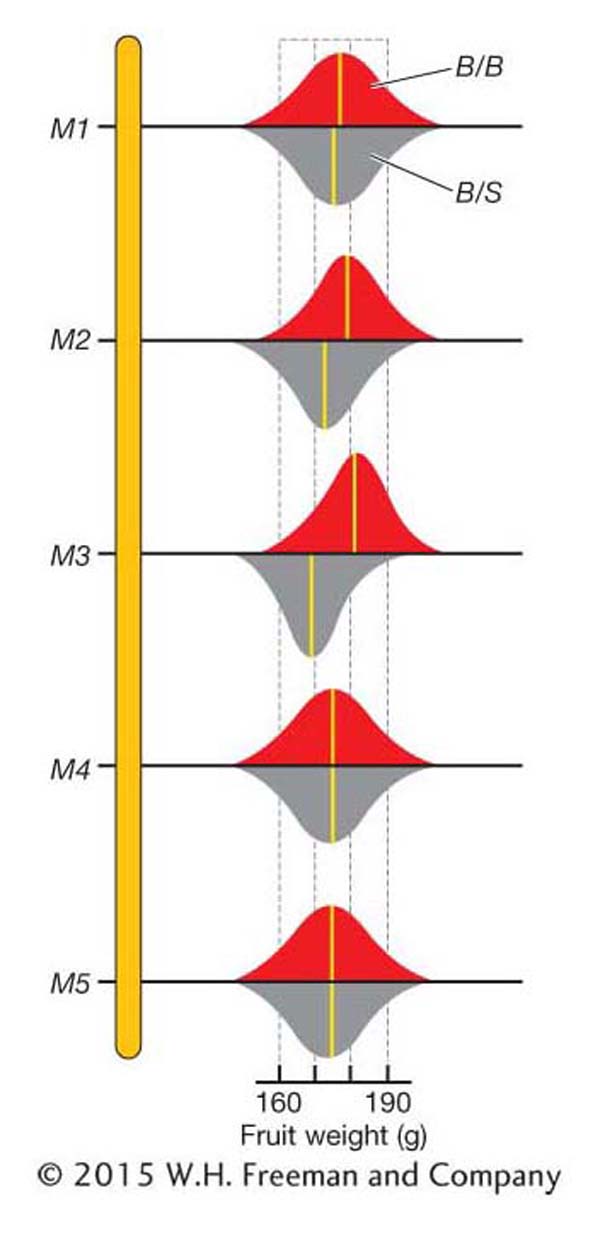
A tomato chromosomal segment with marker loci M1 through M5. At each marker locus, the frequency distributions for fruit weight from a BC1 population of a Beefmaster × Sungold cross are shown. The red distributions are for the homozygous Beefmaster (B/B) genotypic class at the marker; the gray distributions are for the heterozygous (B/S) genotypic class. Yellow lines represent the mean of each distribution.