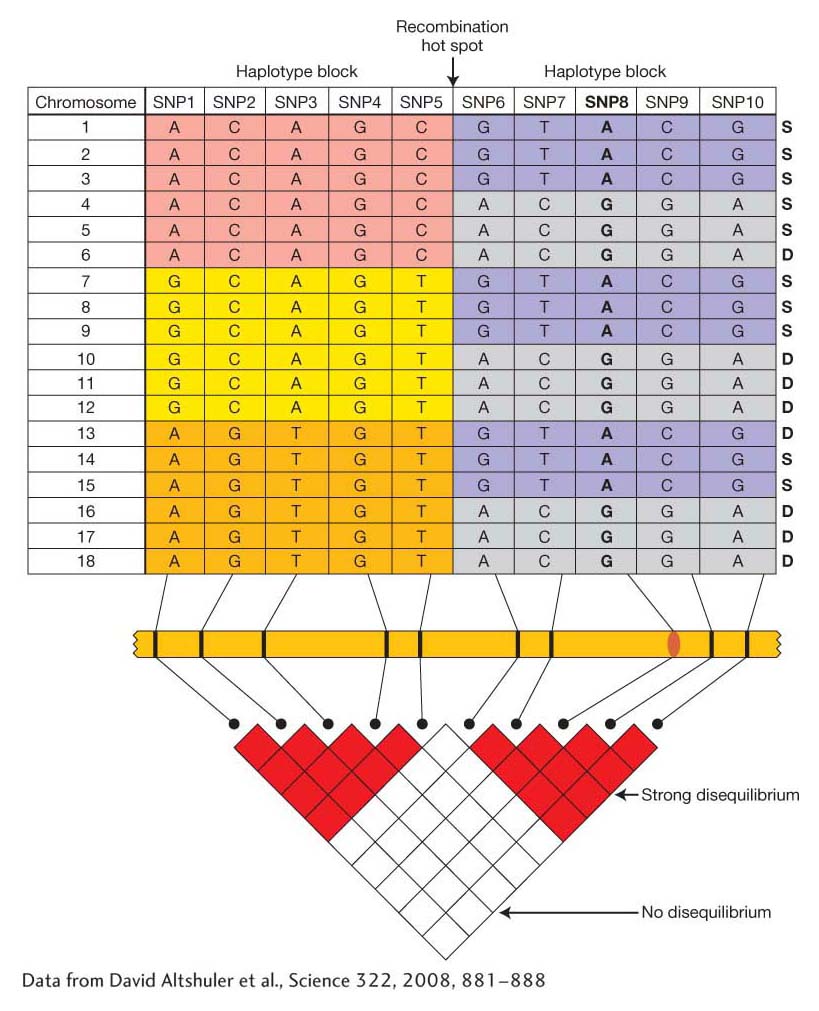
(top) Diagram of the distribution of SNPs and haplotypes for a chromosomal segment from 18 individuals. Haplotypes often occur in blocks (regions of lower recombination) separated from one another by recombination hotspots (different colors indicate haplotype blocks). (The column of S’s and D’s at the right are for Problem 19-
[Data from David Altsftuler et al., Science 322, 2008, 881–