Association mapping identifies genes for disease susceptibility
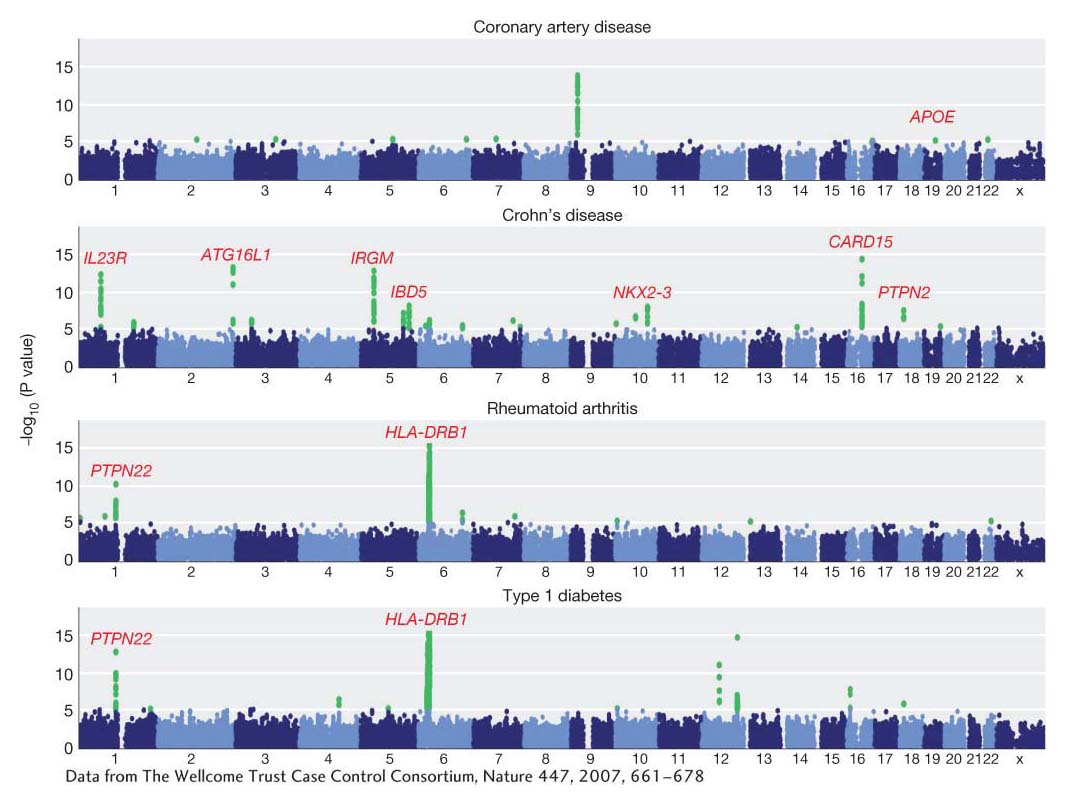
Results from a genome-wide association study of common diseases in humans. The 23 human chromosomes are arrayed from left to right. The y-axis shows the P value for the statistical test of an association between the disease and each SNP. Significant test results are shown as green dots. The names of some genes identified by this analysis are shown in red.
[Data from The Wellcome Trust Case Control Consortium, Nature 447, 2007, 661–678.]