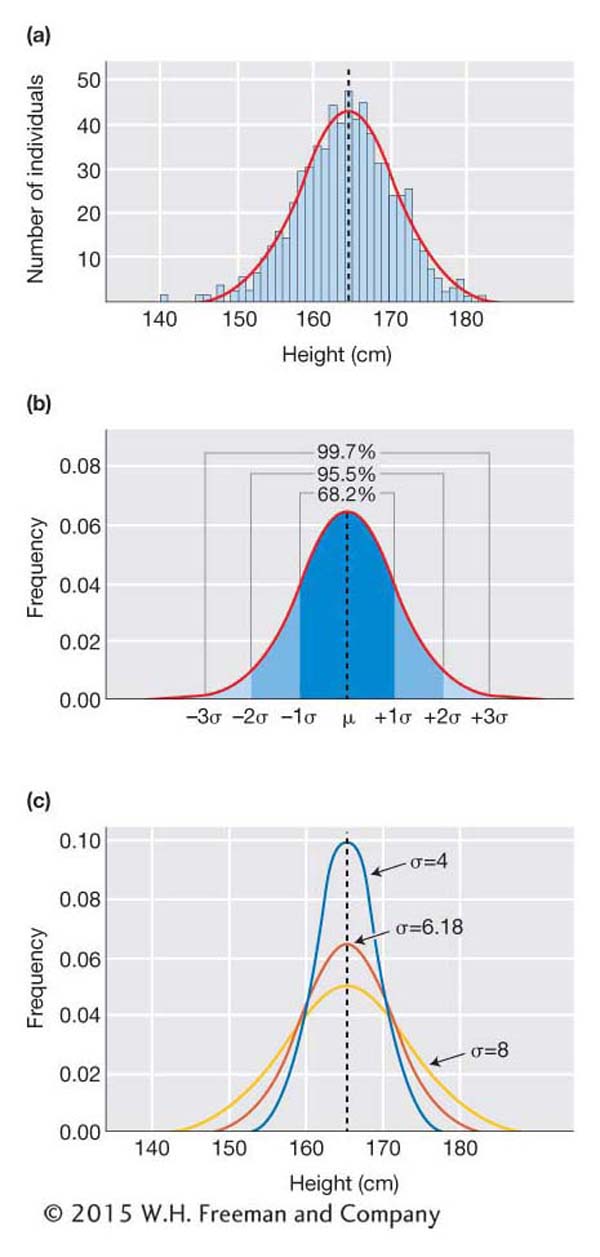
(a) Frequency histogram of actual data for the height of adult women from the United States. The red line represents the normal curve fit to these data with a mean of 164.4 cm and standard deviation of 6.18 cm. (b) Normal curve for the height of U.S. women showing the predicted percentages of women who will fall within different numbers of standard deviations from the mean. (c) Normal curves with the same mean (164.4 cm) but different standard deviations, showing the effect of the standard deviation on the shape of the curve.