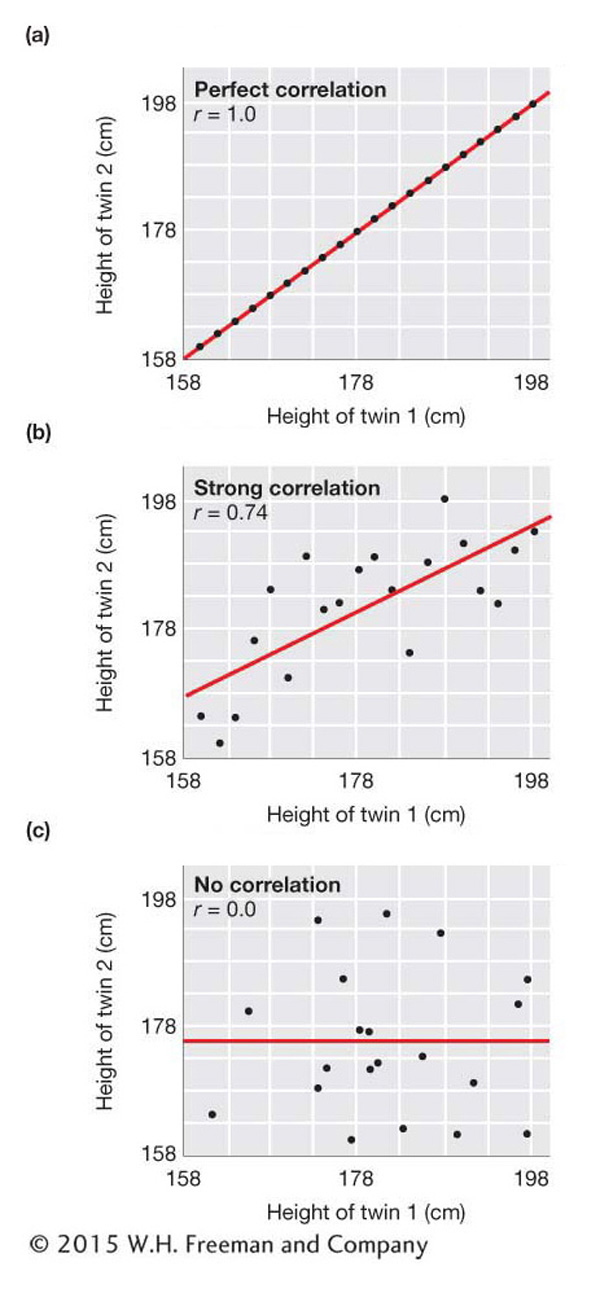
Scatter plots for different strengths of correlation
Scatter plots for the case of a perfect correlation (a), strong correlation (b), and no correlation (c). Red lines have a slope that is equal to the correlation coefficient.