From high cotransduction frequencies, close linkage is inferred
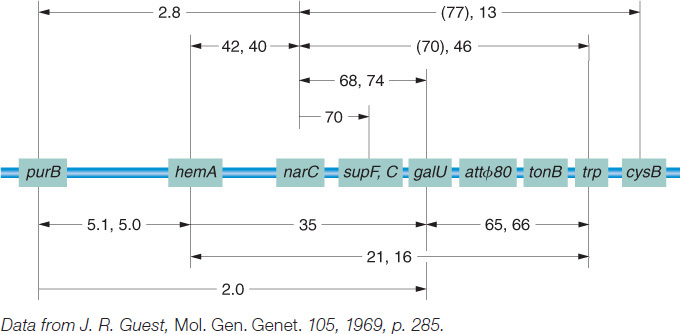
The diagram shows a genetic map of the purB-to-cysB region of E. coli determined by P1 cotransduction. The numbers given are the averages in percent for cotransduction frequencies obtained in several experiments. The values in parentheses are considered unreliable.
[Data from J. R. Guest, Mol. Gen. Genet. 705, 7969, p. 285.]