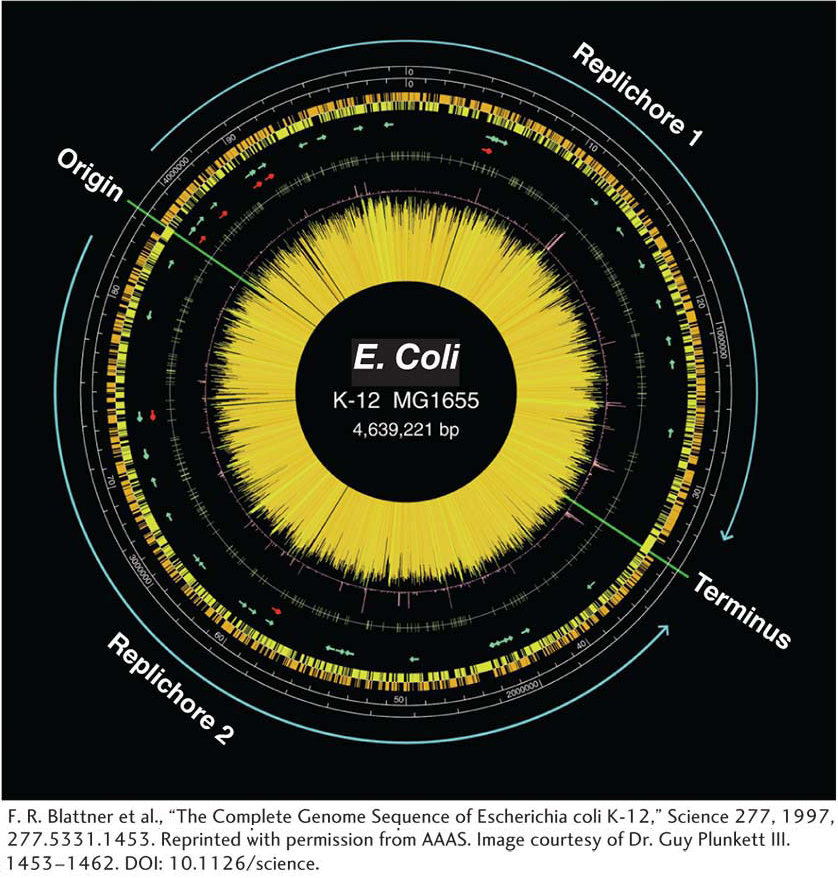
This map was obtained from sequencing DNA and plotting gene positions. Key to components from the outside in:
The DNA replication origin and terminus are marked.
The two scales are in DNA base pairs and in minutes.
The orange and yellow histograms show the distribution of genes on the two different DNA strands.
The arrows represent genes for rRNA (red) and tRNA (green).
The central “starburst” is a histogram of each gene with lines of length that reflect predicted level of transcription.
[F. R. Blattner et al., “The Complete Genome Sequence of Escherichia coli K- 3–