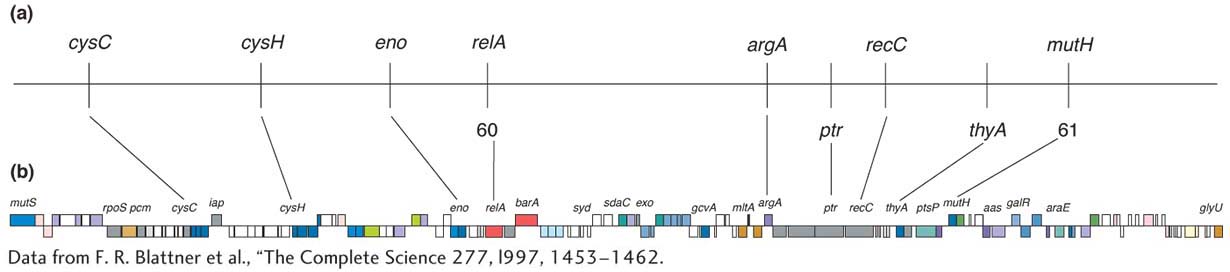
An alignment of the genetic and physical maps. (a) Markers on the 1990 genetic map in the region near 60 and 61 minutes. (b) The exact positions of every gene, based on the complete sequence of the E. coli genome. (Not every gene is named in this map, for simplicity.) The elongated boxes are genes and putative genes. Each color represents a different type of function. For example, red denotes regulatory functions, and dark blue denotes functions in DNA replication, recombination, and repair. Lines between the maps in parts a and b connect the same gene in each map.
[Data from F. R. Blattner et al., “The Complete Science 277, l997, 1453–