1.1 The Birth of Genetics
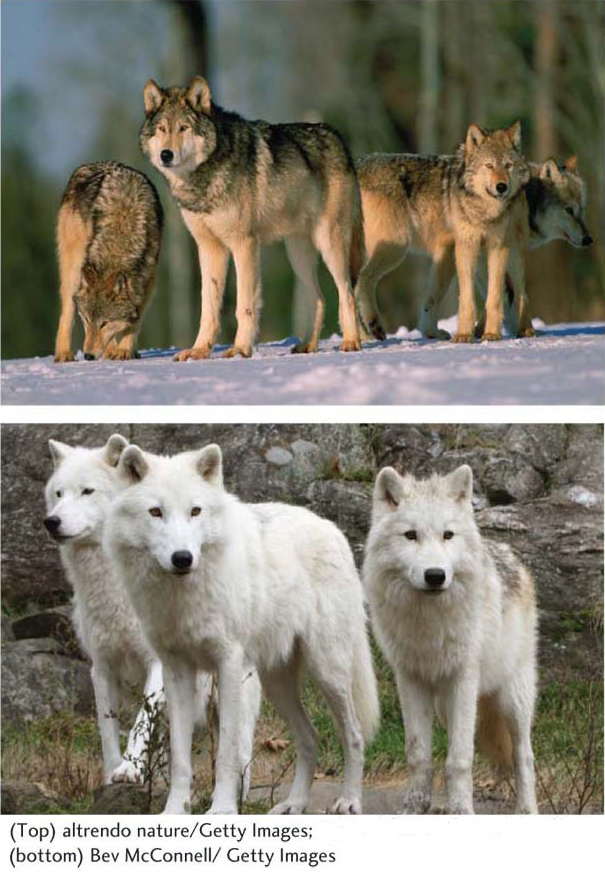
Throughout recorded history, people around the world have understood that “like begets like.” Children resemble their parents, the seed from a tree bearing flavorful fruit will in turn grow into a tree laden with flavorful fruit, and even members of wolf packs show familial resemblances (Figure 1-1). Although people were confident in these observations, they were left to wonder as to the underlying mechanism. The Native American Hopi tribe of the Southwestern United States understood that if they planted a red kernel of maize in their fields, it would grow into a plant that also gave red kernels. The same was true for blue, white, or yellow kernels. So they thought of the kernel as a message to the gods in the Earth about the type of maize the Hopi farmers hoped to harvest. Upon receiving this message, the gods would faithfully return them a plant that produced kernels of the desired color.
In the 1800s in Europe, horticulturalists, animal breeders, and biologists also sought to explain the resemblance between parents and offspring. A commonly held view at that time was the blending theory of inheritance, or the belief that inheritance worked like the mixing of fluids such as paints. Red and white paints, when mixed, give pink; and so a child of one tall parent and one short parent could be expected to grow to a middling height. While blending theory seemed to work at times, it was also clear that there were exceptions, such as tall children born to parents of average height. Blending theory also provided no mechanism by which the “heredity fluids” it imagined, once mixed, could be separated—
3
Gregor Mendel—A monk in the garden
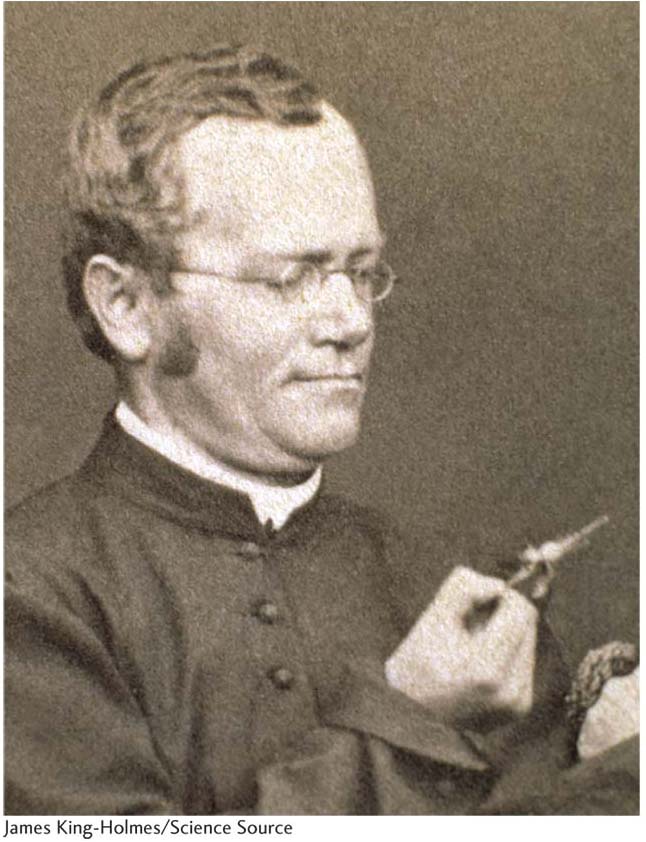
While the merits and failings of blending theory were being debated, Gregor Mendel, an Austrian monk, was working to understand the rules that govern the transmission of traits from parent to offspring after hybridization among different varieties of pea plants (Figure 1-2). The setting for his work was the monastery garden in the town of Brünn, Austria (Brno, Czech Republic, today). From 1856 to 1863, Mendel cross-
4
How did Mendel explain his results? Clearly, blending theory would not work since that theory predicts a uniform group of first-
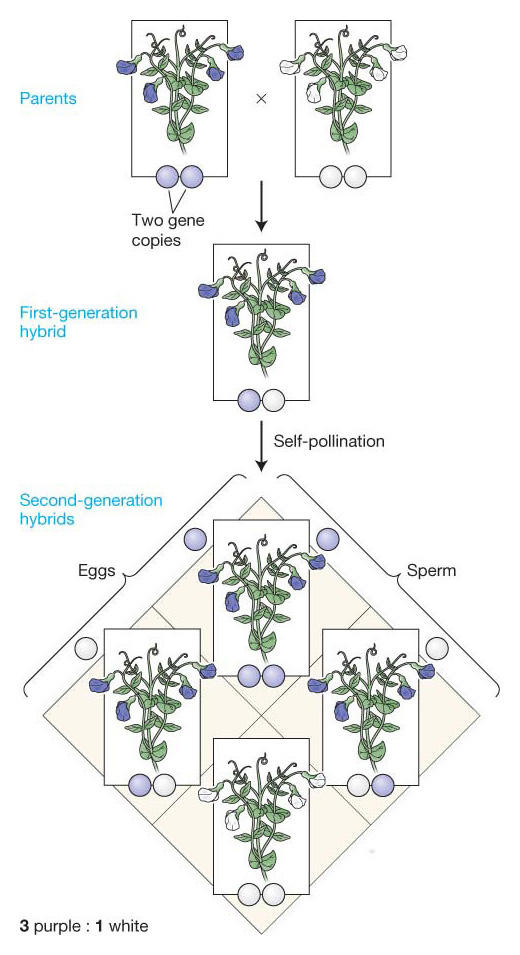
Mendel proposed that each individual pea plant has two copies of the gene controlling flower color in each of the cells of the plant body (somatic cells). However, when the plant forms sex cells, or gametes (eggs and sperm), only one copy of the gene enters into these reproductive cells (see Figure 1-3). Then, when egg and sperm unite to start a new individual, once again there will be two copies of the flower color gene in each cell of the plant body.
Mendel had some further insights. He proposed that the gene for flower color comes in two gene variants, or alleles— one that conditions purple flowers and one that conditions white flowers. He proposed that the purple allele of the flower color gene is dominant to the white allele such that a plant with one purple allele and one white allele would have purple flowers. Only plants with two white alleles would have white flowers (see Figure 1-3). Mendel’s two conclusions, (1) that genes behaved like particles that do not blend together and (2) that one allele is dominant to the other, enabled him to explain the lack of blending in the first-
How did Mendel get it right when so many others before him were wrong? Mendel chose a good organism and good traits to study. The traits he studied were all controlled by single genes. Traits that are controlled by several genes, as many traits are, would not have allowed him to discover the laws of inheritance so easily. Mendel was also a careful observer, and he kept detailed records of each of his experiments. Finally, Mendel was a creative thinker capable of reasoning well beyond the ideas of his times.
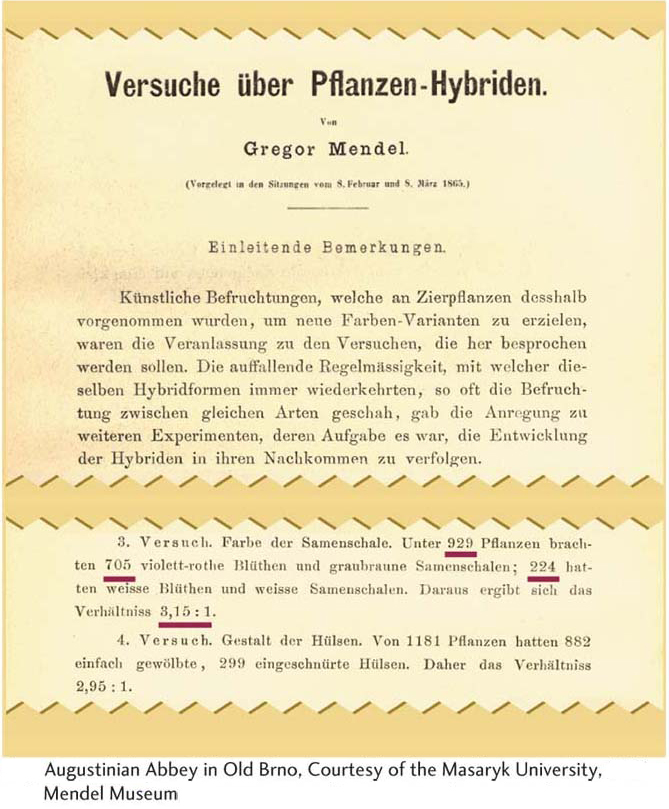
Mendel’s particulate theory of inheritance was published in 1866 in the Proceedings of the Natural History Society of Brünn (see Figure 1-4). At that time, his work was noticed and read by some other biologists, but its implications and importance went unappreciated for over 30 years. Unlike Charles Darwin, whose discovery of the theory of evolution by natural selection made him world-
KEY CONCEPT
Gregor Mendel demonstrated that genes behave like particles and not fluids.5
Mendel rediscovered
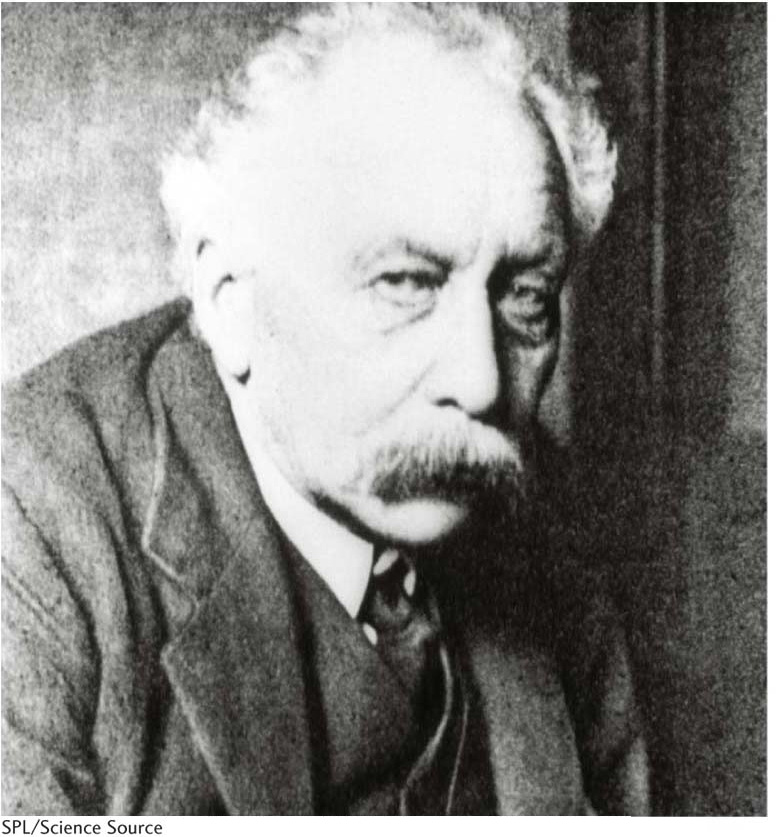
As the legend goes, when the British biologist William Bateson (Figure 1-5) boarded a train bound for a conference in London in 1900, he had no idea how profoundly his world would change during the brief journey. Bateson carried with him a copy of Mendel’s 1866 paper on the hybridization of plant varieties. Bateson had recently learned that biologists in Germany, the Netherlands, and Austria had each independently reproduced Mendel’s 3:1 ratio, and they each cited Mendel’s original work. This trio had rediscovered Mendel’s laws of inheritance. Bateson needed to read Mendel’s paper. By the time he stepped off the train, Bateson had a new mission in life. He understood that the mystery of inheritance had been solved. He soon became a relentless apostle of Mendel’s laws of inheritance. A few years later in 1905, Bateson coined the term genetics—the study of inheritance. The genetics revolution had begun.
When Mendel’s laws of inheritance were rediscovered in 1900, a flood of new thinking and ideas was unleashed. Mendelism became the organizing principle for much of biology. There were many new questions to be asked about inheritance. Table 1-1 summarizes the chronology of seminal discoveries made over the coming decades and the chapters of this text that cover each of these topics. Let’s look briefly at a few of the questions and their answers that transformed the biological sciences.
Where in the cell are Mendel’s genes? The answer came in 1910, when Thomas H. Morgan at Columbia University in New York demonstrated that Mendel’s genes are located on chromosomes—
Can Mendelian genes explain the inheritance of continuously variable traits like human height? While 3:1 segregation ratios could be directly observed for simple traits like flower color, many traits show a continuous range of values in second-
|
Year |
Event |
Chapters |
|---|---|---|
|
1865 |
Gregor Mendel showed that traits are controlled by discrete factors now known as genes. |
2, 3 |
|
1869 |
Friedrich Miescher isolated DNA from the nuclei of white blood cells. |
7 |
|
1903 |
Walter Sutton and Theodor Boveri hypothesized that chromosomes are the hereditary elements. |
2 |
|
1905 |
William Bateson introduced the term “genetics” for the study of inheritance. |
2 |
|
1908 |
G. H. Hardy and Wilhelm Weinberg proposed the Hardy- |
18 |
|
1910 |
Thomas H. Morgan demonstrated that genes are located on chromosomes. |
4 |
|
1913 |
Alfred Sturtevant made a genetic linkage map of the Drosophila X chromosome, the first genetic map. |
4 |
|
1918 |
Ronald Fisher proposed that multiple Mendelian factors can explain continuous variation for traits, founding the field of quantitative genetics. |
19 |
|
1931 |
Harriet Creighton and Barbara McClintock showed that crossing over is the cause of recombination. |
4, 16 |
|
1941 |
Edward Tatum and George Beadle proposed the one- |
6 |
|
1944 |
Oswald Avery, Colin MacLeod, and Maclyn McCarty provided compelling evidence that DNA is the genetic material in bacterial cells. |
7 |
|
1946 |
Joshua Lederberg and Edward Tatum discovered bacterial conjugation. |
5 |
|
1948 |
Barbara McClintock discovered mobile elements (transposons) that move from one place to another in the genome. |
15 |
|
1950 |
Erwin Chargaff showed DNA composition follows some simple rules for the relative amounts of A, C, G, and T. |
7 |
|
1952 |
Alfred Hershey and Martha Chase proved that DNA is the molecule that encodes genetic information. |
7 |
|
1953 |
James Watson and Francis Crick determined that DNA forms a double helix. |
7 |
|
1958 |
Matthew Meselson and Franklin Stahl demonstrated the semiconservative nature of DNA replication. |
7 |
|
1958 |
Jérôme Lejeune discovered that Down syndrome resulted from an extra copy of the 21st chromosome. |
17 |
|
1961 |
François Jacob and Jacques Monod proposed that enzyme levels in cells are controlled by feedback mechanisms. |
11 |
|
1961- |
Marshall Nirenberg, Har Gobind Khorana, Sydney Brenner, and Francis Crick “cracked” the genetic code. |
9 |
|
1968 |
Motoo Kimura proposed the neutral theory of molecular evolution. |
18, 20 |
|
1977 |
Fred Sanger, Walter Gilbert, and Allan Maxam invented methods for determining the nucleotide sequences of DNA molecules. |
10 |
|
1980 |
Christiane Nüsslein- |
13 |
|
1989 |
Francis Collins and Lap- |
4, 10 |
|
1993 |
Victor Ambrose and colleagues described the first microRNA. |
13 |
|
1995 |
First genome sequence of a living organism (Haemophilus influenzae) published. |
14 |
|
1996 |
First genome sequence of a eukaryote (Saccharomyces cerevisiae) published. |
14 |
|
1998 |
First genome sequence of an animal (Caenorhabditis elegans) published. |
14 |
|
2000 |
First genome sequence of a plant (Arabidopsis thaliana) published. |
14 |
|
2001 |
The sequence of the human genome first published. |
14 |
|
2006 |
Andrew Fire and Craig Mello win the Nobel prize for their discovery of gene silencing by double- |
8 |
|
2012 |
John Gurdon and Shinya Yamanaka win the Nobel prize for their discovery that just four regulatory genes can convert adult cells into stem cells. |
8, 12 |
6
7
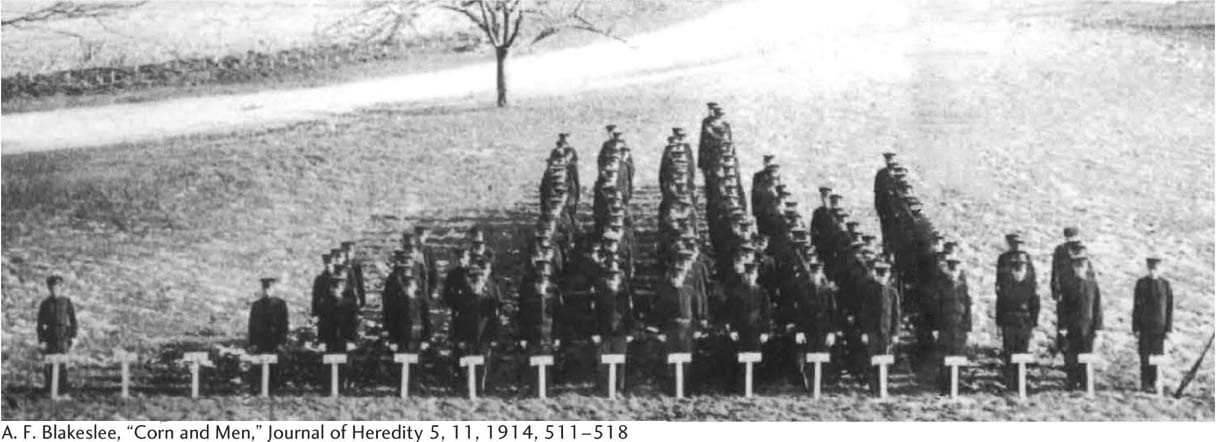
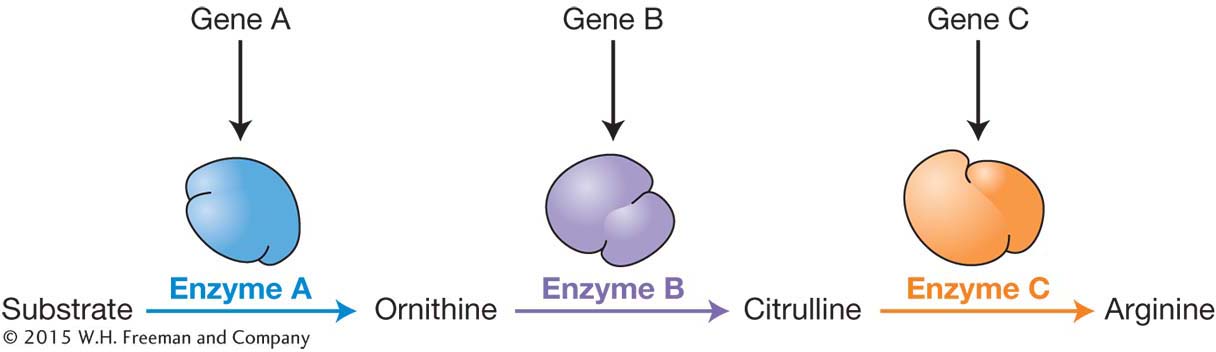
How do genes function inside cells in a way that enables them to control different states for a trait like flower color? In 1941, Edward Tatum and George Beadle proposed that genes encode enzymes. Using bread mold (Neurospora crassa) as their experimental organism, they demonstrated that genes encode the enzymes that perform metabolic functions within cells (Figure 1-7). In the case of the pea plant, there is a gene that encodes an enzyme required to make the purple pigment in the cells of a flower. Tatum and Beadle’s breakthrough became known as the one-
What is the physical nature of the gene? Are genes composed of protein, nucleic acid, or some other substance? In 1944, Oswald Avery, Colin MacLeod, and Maclyn McCarty offered the first compelling experimental evidence that genes are made of deoxyribonucleic acid (DNA). They showed that DNA extracted from a virulent strain of bacteria carried the necessary genetic information to transform a nonvirulent strain into a virulent one. You’ll learn exactly how they demonstrated this in Chapter 7.
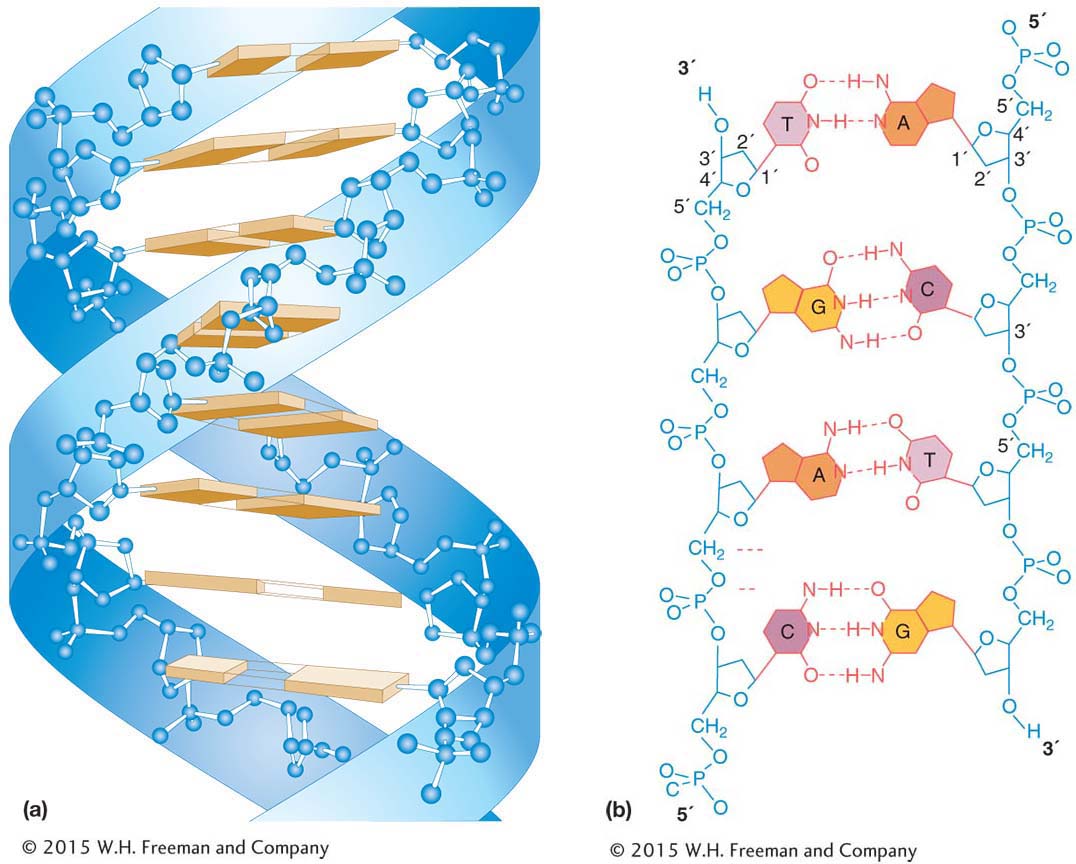
How can DNA molecules store information? In the 1950s, there was something of a race among several groups of geneticists and chemists to answer this question. In 1953, James Watson and Francis Crick working at Cambridge University in England won that race. They determined that the molecular structure of DNA was in the form of a double helix—
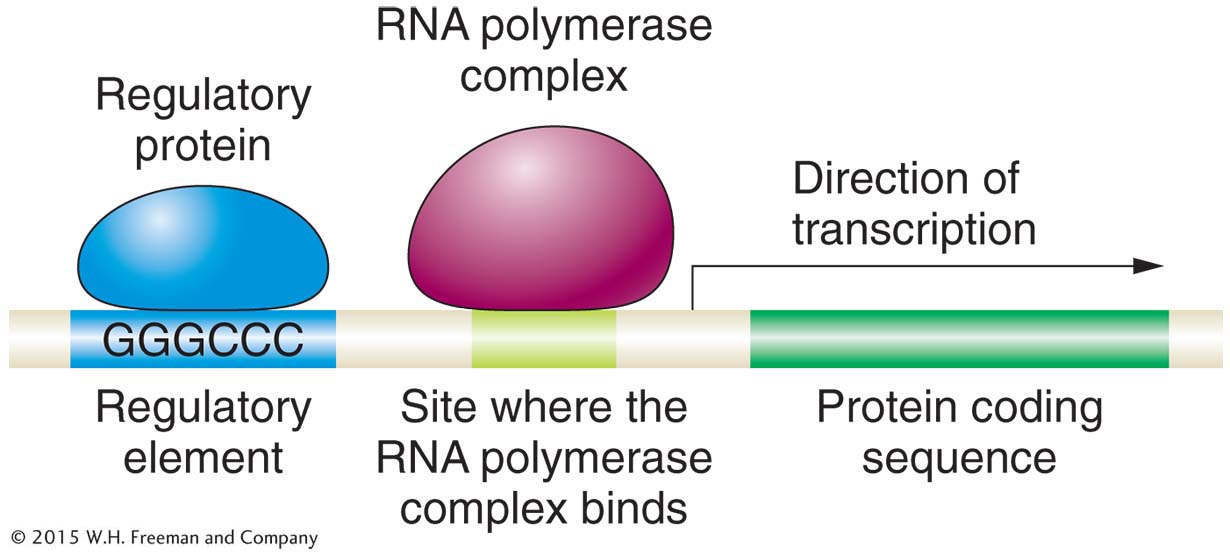
How are genes regulated? Cells need mechanisms to turn genes on or off in specific cell and tissue types and at specific times during development. In 1961, François Jacob and Jacques Monod made a conceptual breakthrough on this question. Working on the genes necessary to metabolize the sugar lactose in the bacterium Escherichia coli, they demonstrated that genes have regulatory elements that regulate gene expression— that is, whether a gene is turned on or off (Figure 1-9). The regulatory elements are specific DNA sequences to which a regulatory protein binds and acts as either an activator or repressor of the expression of the gene. In Chapter 11, you will explore the logic behind the experiments of Jacob and Monod with E. coli, and in Chapter 12, you will explore the details of gene regulation in eukaryotes.
8
How is the information stored in DNA decoded to synthesize proteins? While the discovery of the double-
KEY CONCEPT
The rediscovery of Mendel’s laws launched a new era in which geneticists resolved many fundamental questions about the nature of the gene and the flow of genetic information within cells. During this era, geneticists learned that genes reside on chromosomes and are made of DNA. Genes encode proteins that conduct the basic enzymatic work within cells.9
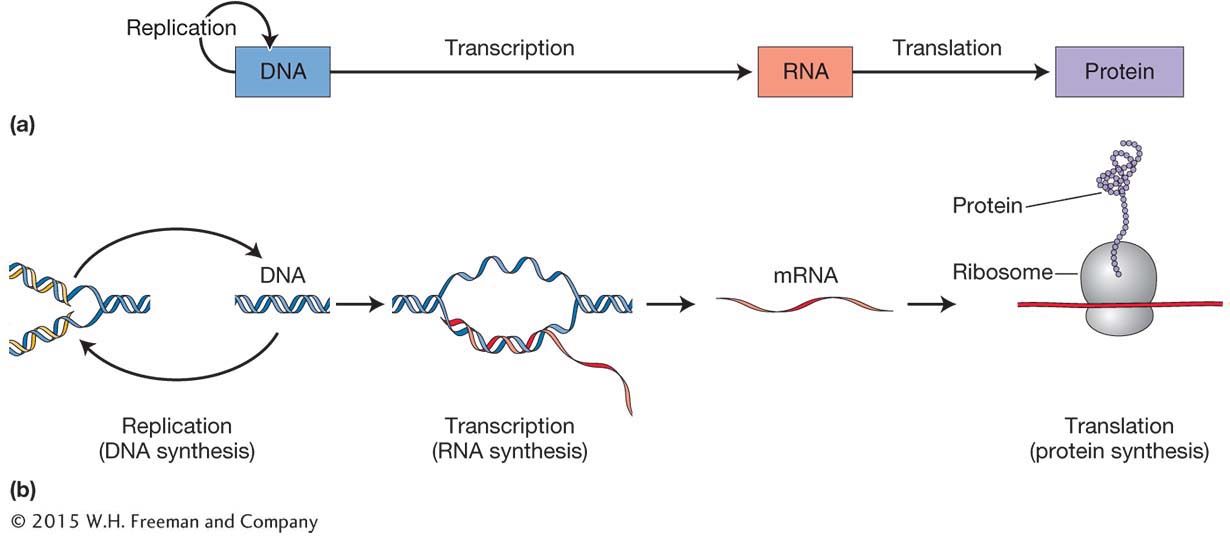
The central dogma of molecular biology
In 1958, Francis Crick introduced the phrase “central dogma” to represent the flow of genetic information within cells from DNA to RNA to protein, and he drew a simple diagram to summarize these relationships (Figure 1-10a). Curiously, Crick chose the word dogma thinking that it meant “hypothesis,” which was his intention, unaware that its actual meaning is “a belief that is to be accepted without doubt.” Despite this awkward beginning, the phrase had an undeniable power and it has survived.
Figure 1-10b captures much of what was learned about the biochemistry of inheritance from 1905 until 1967. Let’s review the wealth of knowledge that this simple figure captures. At the left, you see DNA and a circular arrow representing DNA replication, the process by which a copy of the DNA is produced. This process enables each of the two daughter cells that result from cell division to have a complete copy of all the DNA in the parent cell. In Chapter 7, you will explore the details of the structure of DNA and its replication.
10
Another arrow connects DNA to RNA, symbolizing how the sequence of base pairs in a gene (DNA) is copied to an RNA molecule. The process of RNA synthesis from a DNA template is called transcription. One class of RNA molecules made by transcription is messenger RNA, or mRNA for short. mRNA is the template for protein synthesis. In Chapter 8, you’ll discover how transcription is accomplished.
The final arrow in Figure 1-10b connects mRNA and protein. This arrow symbolizes protein synthesis, or the translation of the information in the specific sequence of bases in the mRNA into the sequence of amino acids that compose a protein. Proteins are the workhorses of cells, comprising enzymes, structural components of the cell, and molecules for cell signaling. The process of translation takes place at the ribosomes in the cytoplasm of each cell. In Chapter 9, you will learn how the genetic code is written in three-
Since Crick proposed the central dogma, additional pathways of genetic information flow have been discovered. We now know that there are classes of RNA that do not code for proteins, instances in which mRNA is edited after transcription, and cases in which the information in RNA is copied back to DNA (see Chapters 8, 9, and 15).