1.3 Genetics Today
In an interview in 2008, Princeton University geneticist Leonid Kruglyak remarked,
“You have this clear, tangible phenomenon in which children resemble their parents. Despite what students get told in elementary-
Although Kruglyak’s remark might seem disparaging to the progress made in the understanding of inheritance over the last 100 years, this was certainly not his intention. Rather, his remark highlights that despite the paradigm-
In this section, we will review four recent advances in genetics—
From classical genetics to medical genomics
Meet patient VI-
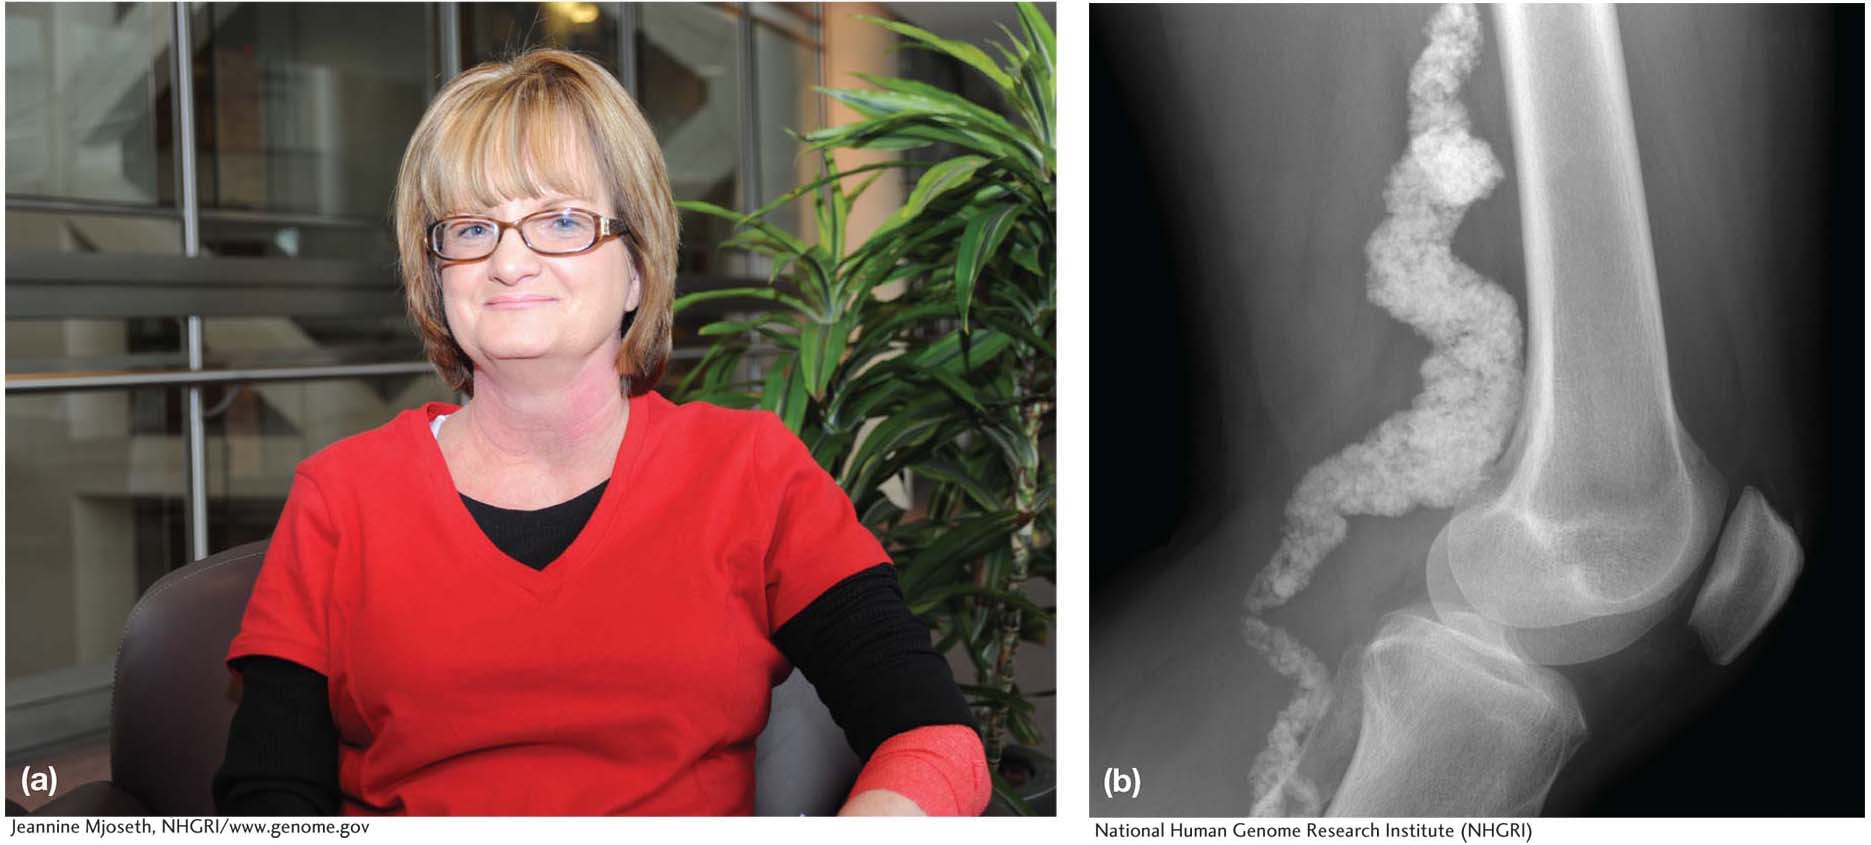
15
The UDP is a group of MDs and scientists that has connections with specialists throughout the National Institutes of Health in every imaginable field of medicine. This is the team that is asked to tackle the most challenging cases. Working with Benge, the UDP team subjected her to nearly every test in their arsenal, and soon they found the underlying defect that caused her disease. Benge had a very low level of an enzyme called CD73. This enzyme is involved in signaling between cells, and specifically it sends a signal that blocks calcification. Now the UDP doctors could give Benge a diagnosis. They named her disease “arterial calcification due to deficiency of CD73,” or ACDC.
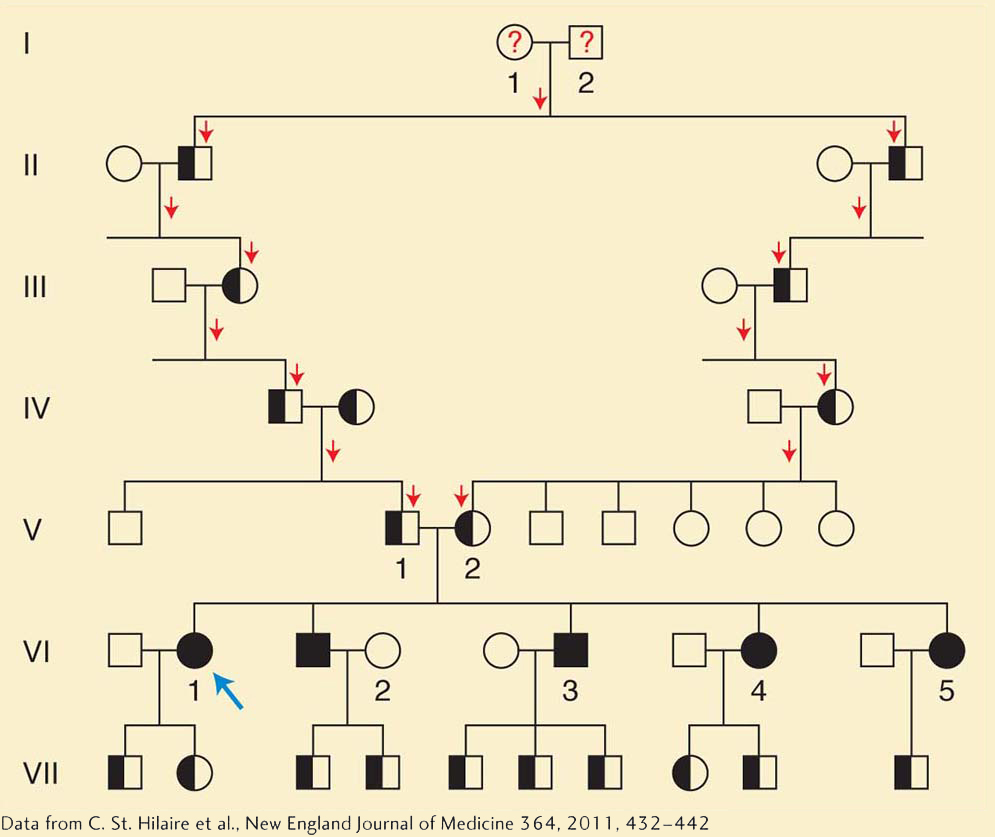
What intrigued the UDP team about Benge’s case was that she was not alone in having this disease. Benge had two brothers and two sisters, and all of them had arterial calcification. Remarkably, however, Benge’s parents were unaffected. Moreover, Benge and her siblings all had children and none of these children had arterial calcification. This pattern of inheritance suggested that the underlying cause might be genetic. Specifically, it suggested that Benge and all of her siblings inherited two defective copies of either CD73 or a gene that influences CD73 expression—
The UDP team delved further into Benge’s family history and learned that Benge’s parents were third cousins (Figure 1-15). This revelation fit well with the idea that the cause was a defective gene. When a husband and wife are close relatives such as third cousins, there is an increased chance that they will both have inherited the same version of a defective gene from their common ancestor and that they will both pass on this defective gene to their children. Children with one copy of a defective gene are often normal, but a child who inherits a defective copy from both parents is likely to have a genetic disorder.
In Figure 1-15, we can see how this works. Benge’s mother and father (individuals V-
16
With this hint from the family history, the UDP team now knew where to look in the genome for the mutant gene. They needed to look for a segment on one of the chromosomes for which the copy that Benge inherited from her mother is identical to the copy she inherited from her father. Moreover, each of Benge’s siblings must also have two copies of this segment identical to Benge’s. Such regions are very rare in people unless their parents are related, as in the case of Benge since her parents are third cousins. Generally, a segment of a chromosome that is just a few hundred base pairs long will have several differences in the sequence of A’s, C’s, G’s, and T’s between the copy we inherited from our mother and the one we inherited from our father. These differences are known as single nucleotide polymorphisms, or SNPs for short (see Box 1-
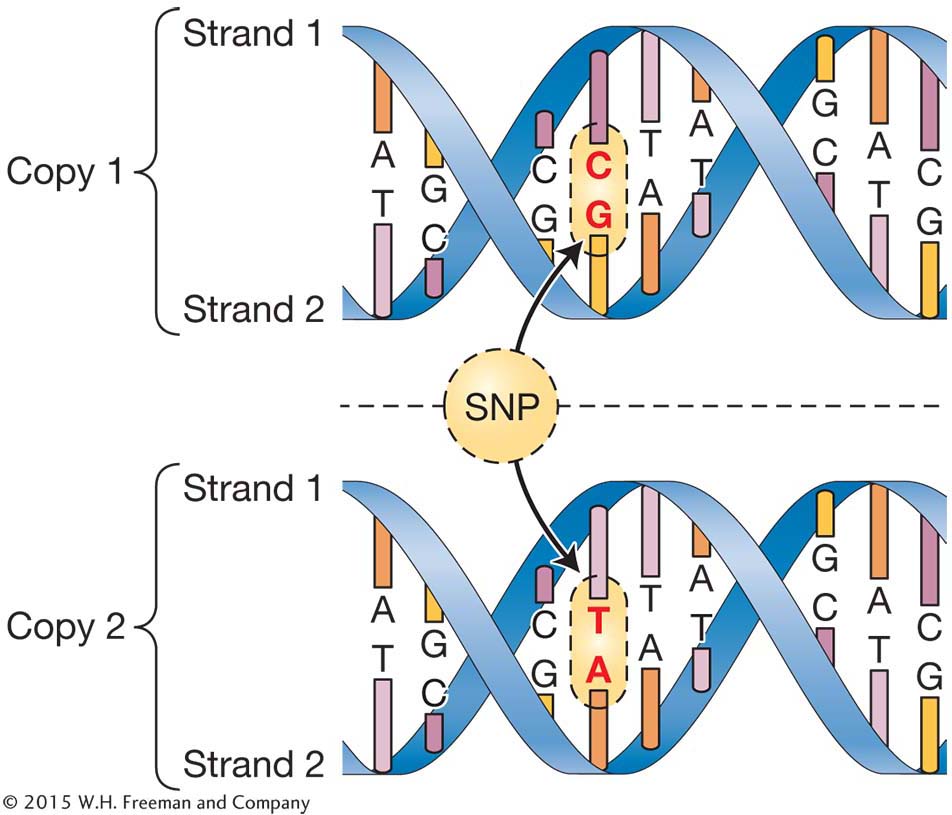
Single Nucleotide Polymorphisms
Genetic variation is any difference between two copies of the same gene or DNA molecule. The simplest form of genetic variation one might observe at a single nucleotide site is a difference in the nucleotide base present, whether adenine, cytosine, guanine, or thymine. These types of variants are called single nucleotide polymorphisms (SNPs), and they are the most common type of variation in most, if not all, organisms. The figure shows two copies of a DNA molecule from the same region of a chromosome. Notice that the bases are the same in the two molecules except where one molecule has a CG pair and the other a TA pair. If we read strand 1 of the two molecules, then the top molecule has a “G” and the lower molecule an “A” at the SNP site.
The UDP team used a new genomic technology, called a DNA microarray (see Chapter 18), that allowed them to study one million base-
Looking over the genome-
The team needed to identify the specific defect in the defective CD73 gene that Benge and her siblings had inherited. After determining the DNA sequence for the CD73 gene from Benge and her siblings, the team found the defect in the gene—
17
Louise Benge’s journey from first experiencing pain in her legs to learning that she had a new disease called ACDC was a long one. The diagnosis of her disease was a triumph made possible by the integration of classic transmission genetics and genomics. Knowing the defect underlying the disease ACDC allowed the doctors to try a medication that they would never have considered before they knew that the cause was a defective CD73 enzyme. The medication in question is called etidronate, and it can substitute for CD73 in signaling cells to keep the calcification pathway turned off. Clinical trials with etidronate are currently underway for ACDC patients and are scheduled for completion in 2017.
KEY CONCEPT
Classical transmission genetics provides the foundation for modern medical genetics. The integration of classical genetics and genomic technologies can allow the causes of inherited diseases to be readily identified.Investigating mutation and disease risk
Shortly after the rediscovery of Mendel’s work, the German physician Wilhelm Weinberg reported that there seems to be a higher incidence of short-
Over the ensuing decades, Weinberg’s and Haldane’s observations were supported by other studies, but the data were not conclusive. Tracing a new mutation in a child to the father versus the mother was fraught with uncertainty, and there was a scarcity of families well-
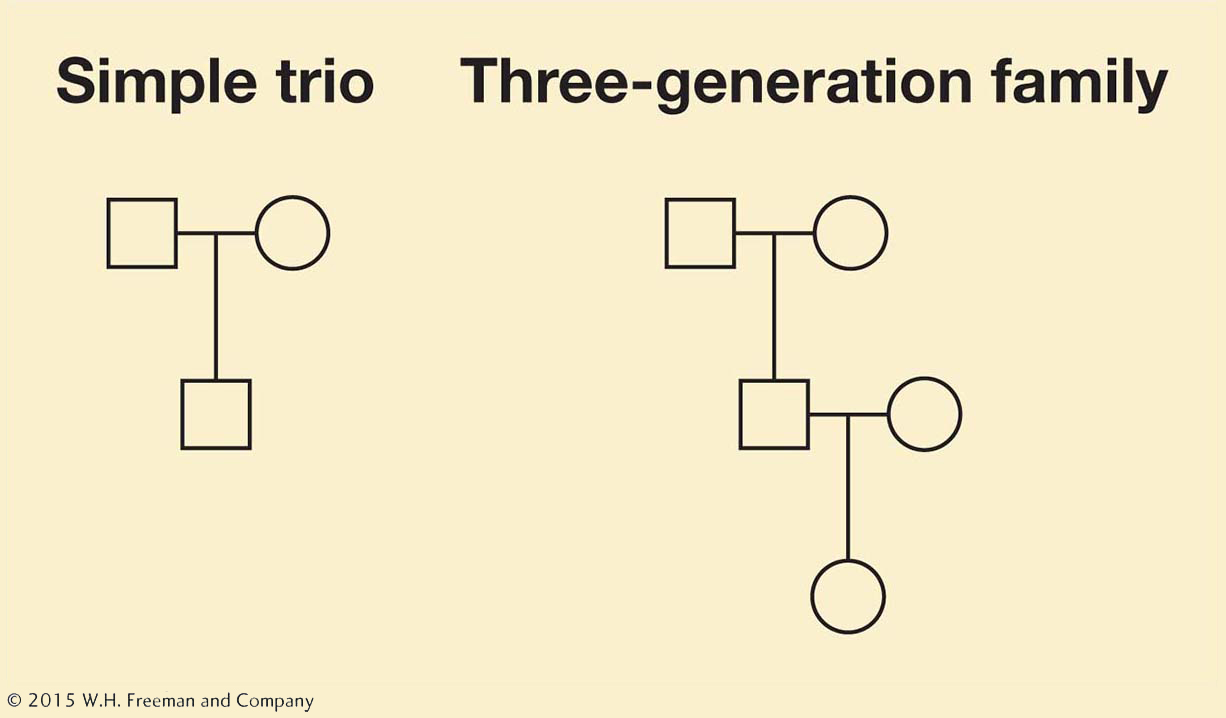
In 2012, advances in genomics and DNA sequencing technology (see Chapter 14) allowed new analyses proving that Weinberg’s and Haldane’s suspicions were correct and providing a very detailed picture of the origin of new mutations within families. Here is how it was accomplished. A team of geneticists in Iceland studied 78 “trios”—a family group of a mother, a father, and their child (Figure 1-16). For some families, they had data for three generations, including a child plus its parents and at least one set of grandparents. The researchers determined the complete genome sequence of each individual with DNA isolated from their blood cells, compiling genome sequences from a total of 219 individuals. Since each individual possesses two copies of every chromosome (i.e., two copies of the human genome), their data actually include the sequences of 438 genomes.
With these genome sequences in hand, the researchers could comb through the data for new or de novo mutations—
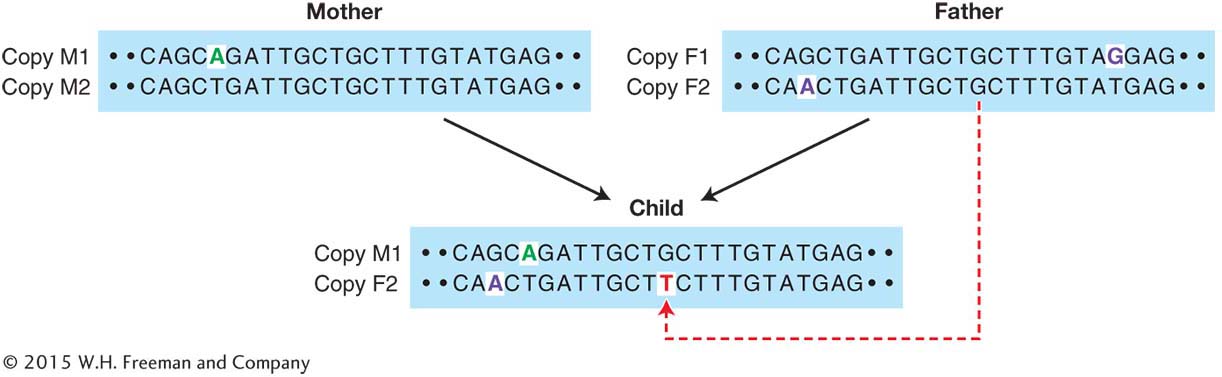
The logic of the discovery process used by the Icelandic geneticists is outlined in Figure 1-17, which shows a segment of DNA for each member of a trio. Each individual has two copies of the segment. Notice that copy M1 in the mother has a SNP (green letter) that distinguishes it from copy M2. Similarly, there are two SNPs (purple letters) that distinguish the father’s two copies of this segment. Comparing the child to the parents, we see that the child inherited copy M1 from its mother and copy F2 from its father. Look closer at the child’s two copies of the segment, and you’ll notice something else. There is a unique variant (red letter) that occurs in the child but neither of its parents. This is a de novo point mutation. It this case, it is a mutation from a guanine (G) to a thymine (T). We can see that the mutation arose in the father since it is on the F2 copy of the segment.
18
Where and exactly when did the new mutation depicted in Figure 1-17 arise? Most of our bodies are composed of somatic cells that make up everything from our brain to our blood. However, we also have a special lineage of cells called the germline that divide to produce eggs in women and sperm in men. New mutations that arise in somatic cells as they divide during the growth and development of our bodies are not passed on to our offspring. However, a new mutation that occurs in the germline can be transmitted to the offspring. The mutation depicted in Figure 1-17 arose in the germline of the father.
With the genome sequence data for the trios, the Icelandic geneticists made some pretty startling discoveries. First, among the 78 children in the study, they observed a total of 4933 new point mutations. Each child carried about 63 unique mutations that did not exist in its parents. Most of these occurred in parts of the genome where they have only a small chance to pose a health risk, but 62 of the 4933 mutations caused potentially damaging changes to the genes such that they altered the amino acid sequence of the protein encoded. Second, among the mutations that could be assigned a parent of origin, there were on average 55 from the father for every 14 from the mother. The children were inheriting nearly four times as many new mutations from their fathers as their mothers. The Icelandic team had confirmed Haldane’s prediction made 90 years earlier.
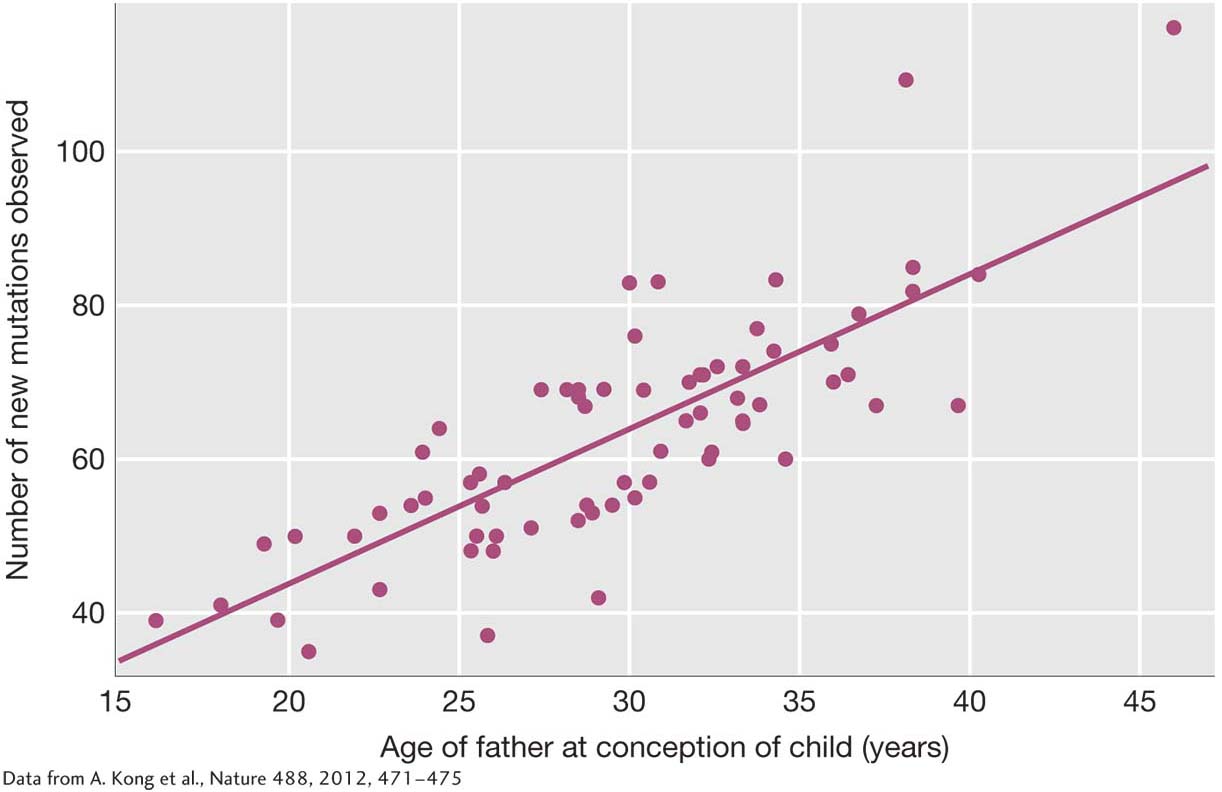
The genome sequences also allowed the team to test Weinberg’s prediction that the frequency of mutation rises with the age of the parents. For each trio, the researchers knew the ages of the mother and the father at the time of conception. When they investigated whether the frequency of mutation rises with the mother’s age when controlling for the age of the father, the team found no evidence that it did. Older mothers did not pass on more new point mutations to their offspring than younger ones. (Older mothers are known to produce more chromosomal aberrations than younger mothers, such as an extra copy of the 21st chromosome that causes Down syndrome; see Chapter 17.) Next, they examined the relationship between mutation and the age of the father when controlling for the age of the mother. Here, they found a powerful relationship. The older the father, the higher the frequency of new point mutations (Figure 1-18). In fact, for each year of increase in his age, a father will pass on two additional new mutations to his children. A 20-
19
Why does the age of the father matter, while that of the mother seems to have no effect on the frequency of new point mutations? The answer lies in the different ways by which men and women form gametes. In women, as in the females of other mammals, the process of making eggs takes place largely before a woman is born. Thus, when a woman is born she possesses in her ovaries a set of egg precursor cells that will mature into egg cells without further rounds of DNA replication. For a woman, from the point when she was conceived until the formation of the egg cells in her ovaries, there are about 24 rounds of cell division, 23 of which have a round of chromosome (DNA) replication and an opportunity for a copying error or mutation. All 23 of these rounds of chromosome replication occur before a woman is born, so there are no additional rounds after her birth and no chance for additional mutations as she ages. Thus, older mothers contribute no more new point mutations to their children than younger mothers.
Sperm production is altogether different. The cell divisions that produce sperm continue throughout a man’s life, and there are many more rounds of cell division in sperm formation than in egg formation. Sperm produced by 20-
There is one final twist to the remarkable project performed by the Icelandic geneticists. The 78 trios that they studied were chosen because the children in most of the trios had inherited disorders. These included 44 children with autism spectrum disorder and 21 with schizophrenia. For all these children, there were no other cases of these disorders among their relatives, suggesting that their condition was due to a new mutation. As anticipated, the researchers observed a correlation between the father’s age and disease risk—
20
Studies such as this can have important implications for individuals and society. Some men who intend to delay parenting until later in life might choose to freeze samples of their sperm while still young. This study also informs us that changes in society can impact the number of new mutations that enter the human gene pool. If men choose to delay fatherhood for postsecondary education or establishing their careers, there will be an associated increase in the number of new mutations among their children. It is common knowledge that infertility rises with age for women—
KEY CONCEPT
Genome sequences of parents and their children clarify the factors that contribute to new point mutations. Fathers contribute four times as many new mutations to their offspring as do mothers. The number of new mutations passed on from a father to his children rises with the age of the father.When rice gets its feet a little too wet
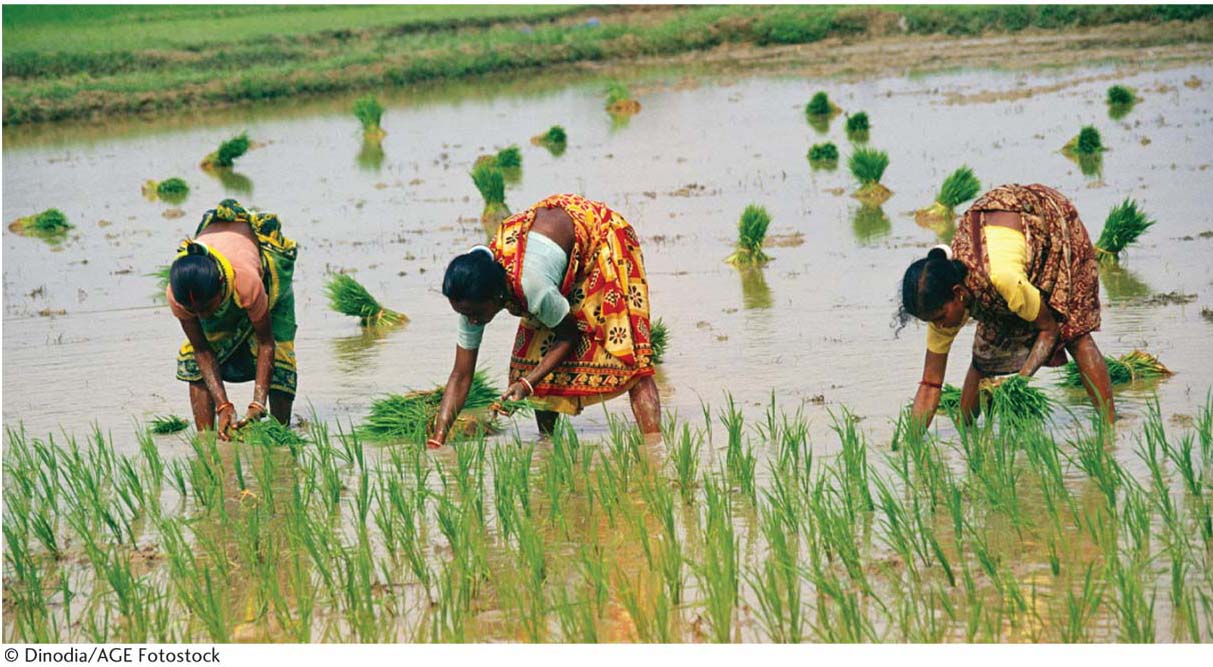
Among the cereal crops, rice is unique. Whereas wheat, barley, maize, and the other grain crops grow solely in dry fields, rice is commonly grown in flooded fields called paddies (Figure 1-19). The ability of rice to grow in flooded fields offers it an advantage: rice can survive modest flooding (up to 25 cm of standing water) in the paddies, but most weeds cannot. So rice farmers can use flooding to control the weeds in their field while their rice thrives.
The strategy works well where farmers have irrigation systems to control the water levels in their paddies and heavy rains do not exceed their capacity to control these levels. If the water in the paddies gets too deep (greater than 50 cm) for a prolonged period, then the rice plants, like the weeds, can suffer or even die.
21
Paddy agriculture, as practiced in the lowlands of India, Southeast Asia, and West Africa, relies on natural rainfall, rather than irrigation, to flood the fields. This circumstance poses a risk. When the rains are heavy, water depth in the paddies can exceed 50 cm and completely submerge the plants, causing rice plants to either suffer a loss in yield or simply die. Of the 60 million hectares of rainfed lowland paddies, one-
In the early 1990s, David Mackill, a plant geneticist and breeder at the International Rice Research Institute, had an idea about how to improve rice so that it could tolerate being submerged in flood waters. He identified a remarkable variety of rice called FR13A that could survive submergence and even thrive after the plants remained fully submerged in deep water for up to two weeks. Unfortunately, FR13A had a low yield and the quality of its grain was marginal. So Mackill set out to transfer FR13A’s genetic factor(s) for submergence tolerance into a rice variety with a higher yield and higher grain quality. He first crossed FR13A and a superior variety of rice and then for several generations crossed the hybrid plants back to the superior variety until he had created an improved form of rice that combined submergence tolerance and high yield.
Mackill had achieved his initial goal of transferring submergence tolerance into a superior variety, but the genetic basis for why FR13A was submergence tolerant remained obscure. Was FR13A’s submergence tolerance controlled by many genes on multiple chromosomes, or might it be mostly controlled by just one gene? To delve into the genetic basis of submergence tolerance, Mackill and his team conducted a form of genetic analysis called quantitative trait locus (QTL) mapping (see Chapter 19). A QTL is a genetic locus that contributes incrementally or quantitatively to variation for a trait. Mendel’s gene for flower color had two categorical alleles: one for purple flowers and the other for white flowers. QTL have alleles that usually engender only partial changes such as the difference between a pale purple and a medium purple. Using QTL mapping, Mackill learned that the secret to FR13A exceptionalism was mostly due to a single genetic locus or QTL on one of the rice chromosomes. He named this locus SUB1 for “submergence tolerant.”
With the chromosomal location of SUB1 revealed, it was time to delve even deeper and identify the molecular nature of SUB1. What type of protein did it encode? How did the allele of SUB1 found in FR13A allow the plant to cope with submergence? What is the physiological response that enables the plant to survive submergence?
To address these questions, molecular geneticists Pamela Ronald at the University of California, Davis, and Julia Bailey-
22
The next question was, how does switching on SUB1 enable FR13A to survive complete submergence? To answer this question, let’s review how ordinary rice plants respond to submergence. When a plant is completely submerged, oxygen levels in its cells drop to a low level, and the concentration of ethylene, a plant hormone, in the cells increases. Ethylene signals the plant to escape submergence by elongating its leaves and stems to keep its “head” above water. This escape strategy works fine as long as the water is not so deep that the plant fails to grow enough to position its stems and leaves above the flood waters. If the flood waters are too deep, then the plant cannot grow enough to escape. As a plant in such deeply flooded circumstances grows to escape the flood water, it uses up all its energy reserves (carbohydrates), becomes spindly and weak, and eventually dies.
How does the FR13A variety manage to survive submergence while many other types of rice cannot? FR13A has a different strategy that could be called sit tight. In response to complete submergence, rather than attempt rapid growth to escape the flood, an FR13A plant using the sit-
The sit-
23
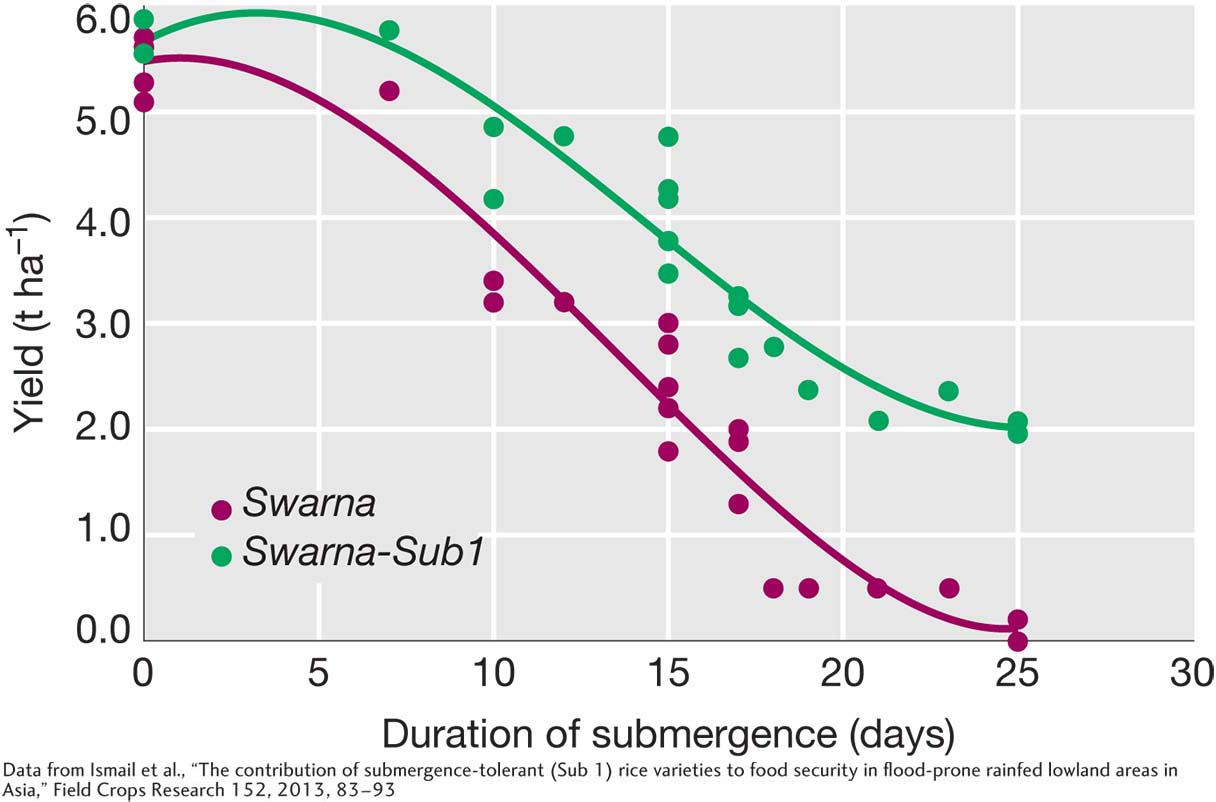
With the basic genetics of SUB1 elucidated, it was time to put this knowledge to work. The team repeated Mackill’s early breeding work to transfer the flood tolerance into a superior variety. Now, however, since they knew the precise location of SUB1 on one of the chromosomes, they could transfer it into a superior variety with surgical precision. This precision is important because it enabled the team to avoid transferring other undesirable genes at the same time. For this project, they worked with a submergence-
With the support and sponsorship of international research organizations, governmental agencies, and philanthropies, Swarna-
In the long run, the impact of the SUB1 research may not be limited to rice. Many crops are subjected to damaging floods that reduce yields or destroy the crop altogether. The genetic research on SUB1 has provided a deep understanding of the molecular genetics of how plants respond to flooding. With this knowledge, it will be possible to manipulate the genomes of other crop plants so that they too can withstand getting their feet a little too wet.
KEY CONCEPT
Genetics and genomics are playing a leading role in improving crop plants. The basic principles of genetics that you will learn during your genetics course are the foundation for these advances.Recent evolution in humans
One goal of genetics is to understand the rules that govern how genes and the information they encode change over the generations within populations. The genes in populations change over time for several different reasons. For example, as we have seen, mutation in the germline can cause a new gene variant or allele to occur in the next generation that was not present in the current generation. Another factor is natural selection, which was first described by Charles Darwin. Briefly, if individuals with a certain gene variant contribute more offspring to the next generation than individuals who lack that variant, then the frequency of that variant will rise over time in the population. The last three chapters of the text focus on rules governing the transmission of genes from one generation to the next within populations.
Over the past decade, evolutionary geneticists have described in remarkable detail how genetic changes have enabled human populations to adapt to the conditions of life on different parts of the globe. This work revealed that three factors have been particularly powerful in shaping the types of gene variants that occur in different human populations. These factors are (1) pathogens such as malaria or smallpox; (2) local climatic conditions including solar radiation, temperature, and altitude; and (3) diet, such as the relative amounts of meat, cereals, or dairy products eaten. In Chapter 20, you’ll learn how a genetic variant in the hemoglobin gene has enabled people in Africa to adapt to the ravages of malaria. Let’s look briefly at examples of genetic adaptations to climate and diet. We’ll start with a case of human adaptation to life at high altitude.
24
Adaptation to high altitude In their effort to colonize the Andes mountains of South America, Spanish colonists established towns high up in the mountains near the settlements of the native peoples. Soon they realized something was wrong. Spanish parents were not producing children. At Potosi, Bolivia, which is situated 4000 meters above sea level, it was 53 years after the founding of the town before the first child was born to Spanish parents. As noted by the Spanish priest Father Cobo, “The Indians are healthiest and where they multiply the most prolifically is in these same cold air-
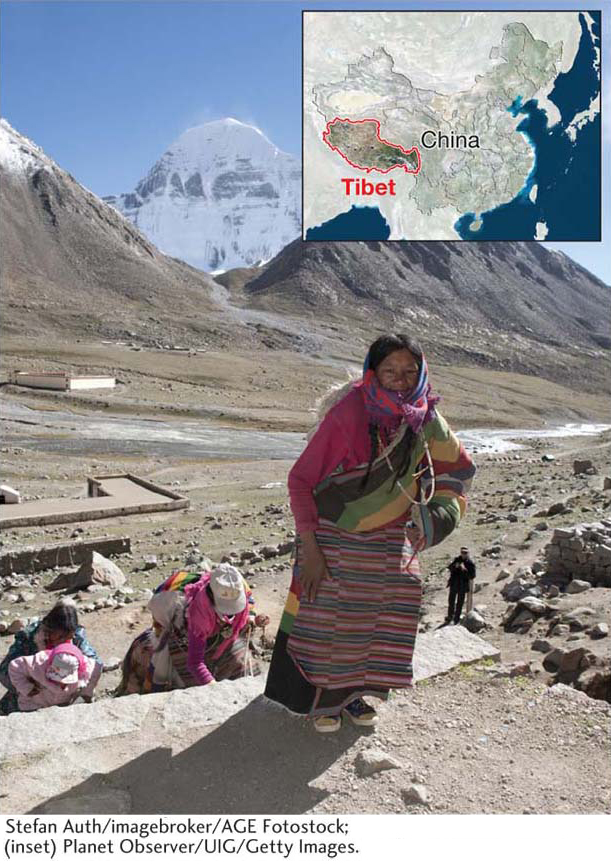
Since early observations like these, geneticists have invested much effort into the study of human adaptation to high altitude in South America, Tibet, and Ethiopia. What enables the natives of these regions to flourish while lowlanders who move to high elevations suffer the grave health consequences of CMS? Let’s look at the case in Tibet, where the Tibetan highlanders live at altitudes up to 4000 meters above sea level (Figure 1-22). The high Tibetan Plateau was colonized by people about 3000 years ago, and the people who colonized Tibet are closely related to the modern Han Chinese. However, at high altitude, native Tibetans are far less likely than Han Chinese to experience CMS and conditions such as pulmonary hypertension and the associated formation of blood clots that underlie it.
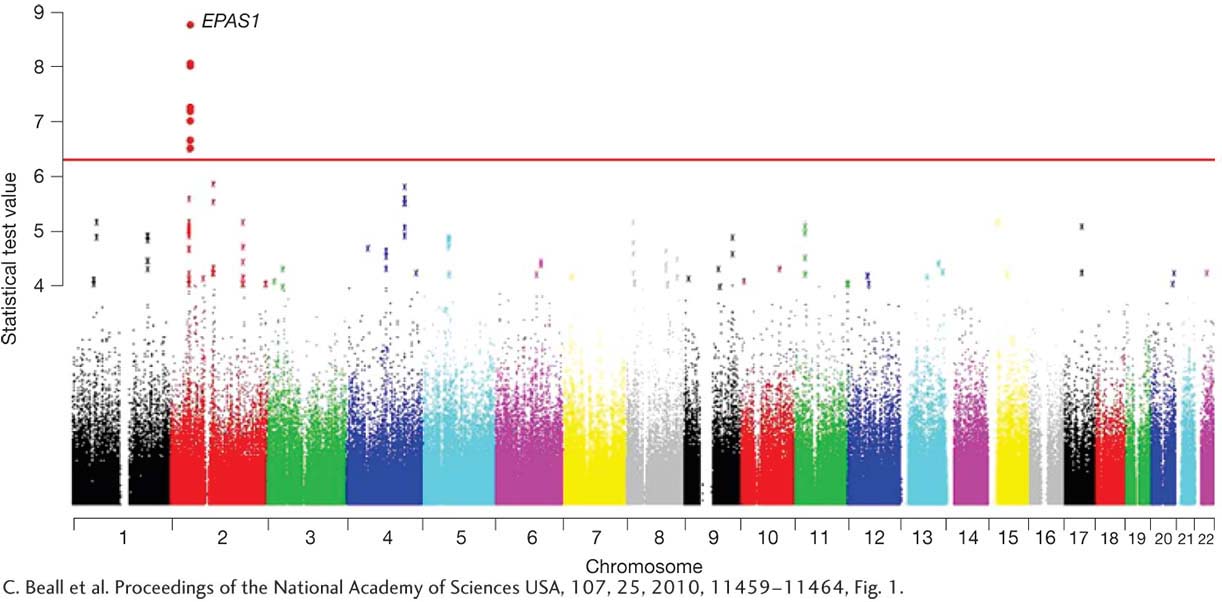
To understand the genetics of how Tibetans adapted to life at high elevation, a research team led by Cynthia Beall of Case Western Reserve University compared Tibetans to Han Chinese at over 500,000 SNPs across the genome. Since Tibetans and Chinese are closely related, one expects each SNP variant to occur at about the same frequency in both groups. If the T variant of a SNP occurs at a frequency of 10 percent in Han Chinese, it should also be at about 10 percent in Tibetans. However, if the variant is associated with improved health at high elevation, its frequency would have risen among Tibetans over the many generations since they colonized the Tibetan Plateau, because Tibetans with this variant would have been healthier and have had more surviving children than those who lacked it. Charles Darwin’s natural selection would be at work.
When the research team analyzed their SNP data, the SNPs in one gene stood out. The gene is called EPAS1, and some SNPs in it occur at very different frequencies in Tibetans (87 percent) and Han Chinese (9 percent). Their results are shown in Figure 1-23. In this figure, the human chromosomes, numbered 1 through 22, are along the x-
25
These results suggest that Tibetans have a special variant of EPAS1 that helps them adapt to life at high elevation. To understand this better, let’s first review what is known about EPAS1. This gene regulates the number of red blood cells (RBCs) that our bodies produce. Moreover, it regulates the number of RBCs in response to the level of oxygen in our tissues. When oxygen levels in our tissues are low, EPAS1 signals the body to produce more RBCs.
Why does EPAS1 direct our bodies to produce more RBCs when the oxygen levels in our tissues are low? The EPAS1 response to low oxygen may be how our bodies normally respond to anemia (too few red blood cells). People with low RBC counts get too little oxygen in their tissues, and so EPAS1 could signal the body to make more RBCs to correct anemia. This mechanism could explain why people who live at low elevation need the EPAS1 gene.
Now, let’s think about how a person from low elevation would respond if they move to high elevation. Because of the thin air at high elevation, their tissues would get less oxygen. If their bodies interpreted low oxygen due to thin air as a sign of anemia, then EPAS1 would try to correct the problem by signaling their body to make more RBCs. However, since they are not anemic and already have enough RBCs, their blood would become overloaded with RBCs. Too many RBCs can cause pulmonary hypertension and the formation of blot clots, the conditions underlying CMS.
26
Finally, how could a new variant of EPAS1 have helped Tibetans avoid CMS and adapt to high elevation? The answer to this question is not known, and it is now being actively investigated, but here is one hypothesis. Unlike lowlanders, Tibetans maintain relatively normal levels of RBCs at high elevation, and they have a lower risk of blot clot formation and pulmonary hypertension than lowlanders who move to high elevation. Thus, the Tibetan version of EPAS1 may no longer cause the overproduction of RBCs at high elevation, while providing another mechanism to cope with the thin air. The Tibetan variant of EPAS1 helps them live at high elevation without suffering from CMS.
Lactose tolerance Before the invention of agriculture about 10,000 to 12,000 years ago, human populations subsisted on foods harvested from nature by hunting wild animals and gathering wild fruits and vegetables. At that time, no human populations used dairy products. Cattle were yet to be domesticated, and methods for milking cows were not yet invented. Children nursed on mother’s milk, but as they aged, the gene that encodes the enzyme lactase, which enables children to digest milk sugar (lactose), was switched off. Once weaned, a child in pre-
With the origin of agriculture, cattle were domesticated from wild aurochs. The early farmers may have kept cattle as a source of meat at first. After milking was invented, milk offered another source of food. But there was a problem. Although children in these ancient societies could digest milk sugar, the adults could not. Adults could consume milk, but since they could not digest the lactose, they would experience bloating, cramps, and diarrhea. Adults who experience these symptoms from drinking milk are lactose intolerant. Importantly, because they could not digest milk sugar, they were not utilizing this source of nutrition.
In ancient societies, where food could be scarce at times, the difference between life and death could hinge on making the best use of all available food sources. Yet, because the lactase gene is switched off in adults, adults could not digest milk sugar. Now, suppose a new mutation entered the population and that this mutation allowed the lactase gene to be expressed in adults. Adults with this new mutation or variant could then benefit from drinking milk in a way that adults who lacked this variant could not. Such a benefit could increase their chances to survive and have children, and over time the variant that provides lactase persistence into adulthood would become more common in the population.
27
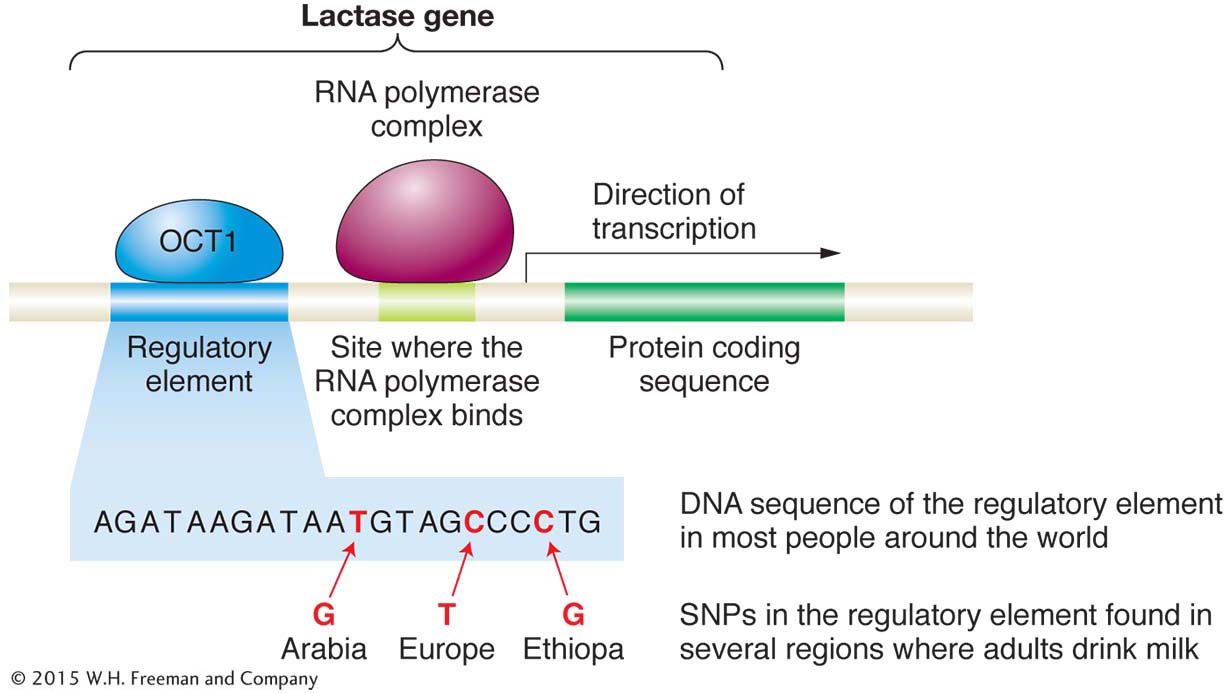
The scenario just described is what appears to have happened during human history in several areas of the world where people kept cattle (or camels) and used them for milk. It happened in Europe, the Middle East, and Africa. In Europe, some people have a variant of the lactase gene that has a “T” at a particular SNP, whereas people from other regions of the world have a “C” at this SNP. Recently, geneticists discovered that the “T” appears to be located in a regulatory element that controls when the lactase gene is turned on (Figure 1-24). People with the “T” variant have persistent expression of the lactase gene into adulthood, whereas people with the “C” variant have their lactase gene switched off after childhood. The “T” seems to enable a regulatory protein called OCT1 to bind near the lactase gene and thereby cause its expression in adults. Other variants that have the same effect appear to have arisen independently in the Middle East and Africa.
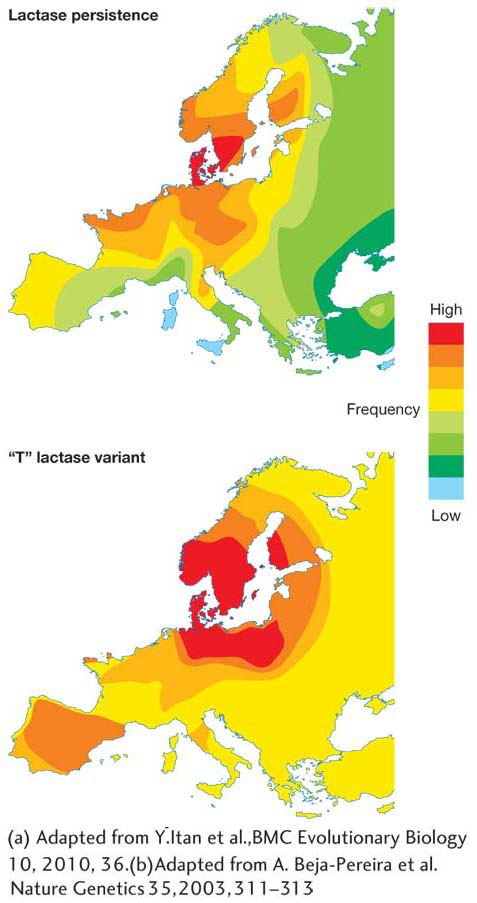
As shown in Figure 1-25, in northern Europe where cattle farming and dairy consumption are prominent, both lactase persistence and the “T” lactase variant that produce it are common, while these features are much less common in southern Europe. Geneticists infer that the early cattle farmers of northern Europe who had the “T” variant benefited from milk consumption, enabling them to survive and produce more offspring, and so this variant became more common in the population over time. Today, the “T” variant is at a frequency of 90 percent in northern Europe. Since milk was not as important a part of the diet in southern Europe, the T variant offered no special benefit and thus remained at a lower frequency (about 10 percent).
These two examples highlight how human populations have evolved in recent times in response to the conditions of life such as the available food and climate. In the last three chapters of this text, you will learn the theory and methods used by geneticists to understand how populations evolve in response to their environment. You’ll learn how SNP data are gathered, how frequencies of variants are calculated, and how comparisons are made to understand the forces that have influenced the types of gene variants that occur in different populations. Through this type of analysis, evolutionary geneticists have learned a vast amount about how different species of plants, animals, fungi, and microbes have evolved and continue to evolve in response to the conditions in which they live.
KEY CONCEPT
Evolutionary genetics provides the tools to documenthow gene variants that provide a beneficial effect can rise in frequency in a population and make individuals in the population better adapted to the environment in which they live.28