2.1 Single-Gene Inheritance Patterns
Recall that the first step in genetic dissection is to obtain variants that differ in the property under scrutiny. With the assumption that we have acquired a collection of relevant mutants, the next question is whether each of the mutations is inherited as a single gene.
Mendel’s pioneering experiments
The first-
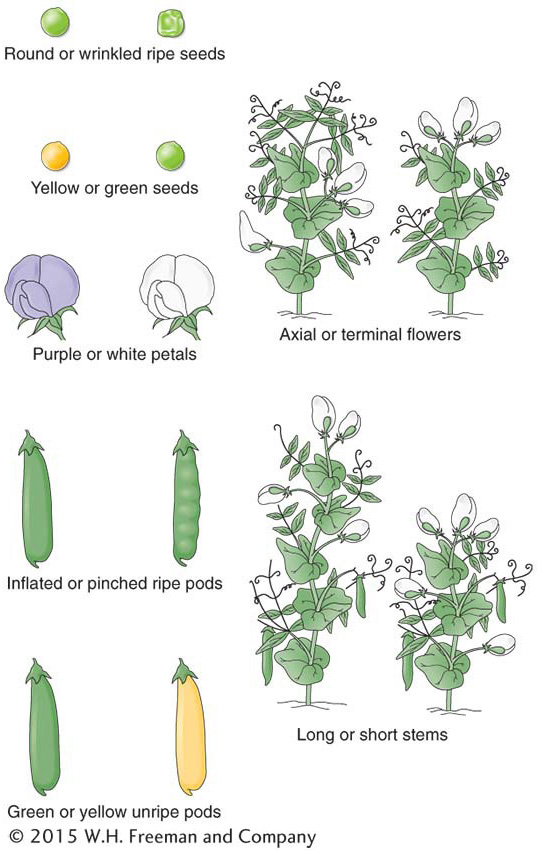
Mendel chose to investigate the inheritance of seven properties of his chosen pea species: pea color, pea shape, pod color, pod shape, flower color, plant height, and position of the flowering shoot. In genetics, the terms character and trait are used more or less synonymously; they roughly mean “property.” For each of these seven characters, he obtained from his horticultural supplier two lines that showed distinct and contrasting phenotypes. These contrasting phenotypes are illustrated in Figure 2-2. His results were substantially the same for each character, and so we can use one character, pea seed color, as an illustration. All of the lines used by Mendel were pure lines, meaning that, for the phenotype in question, all offspring produced by matings within the members of that line were identical. For example, within the yellow-
35
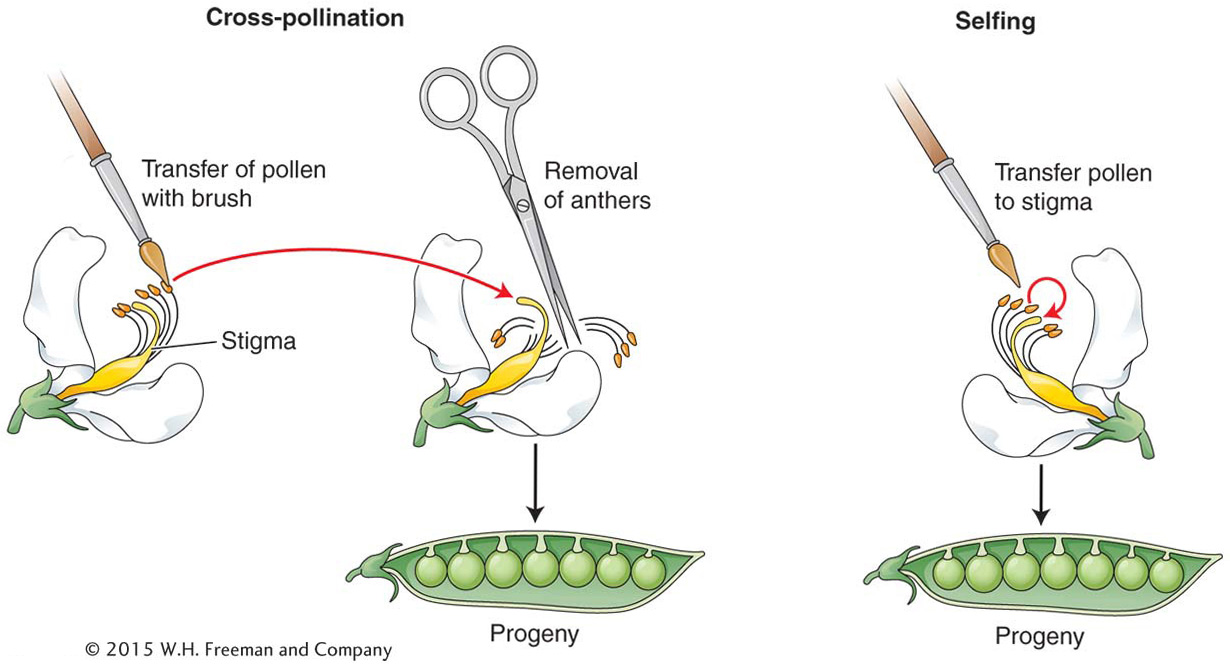
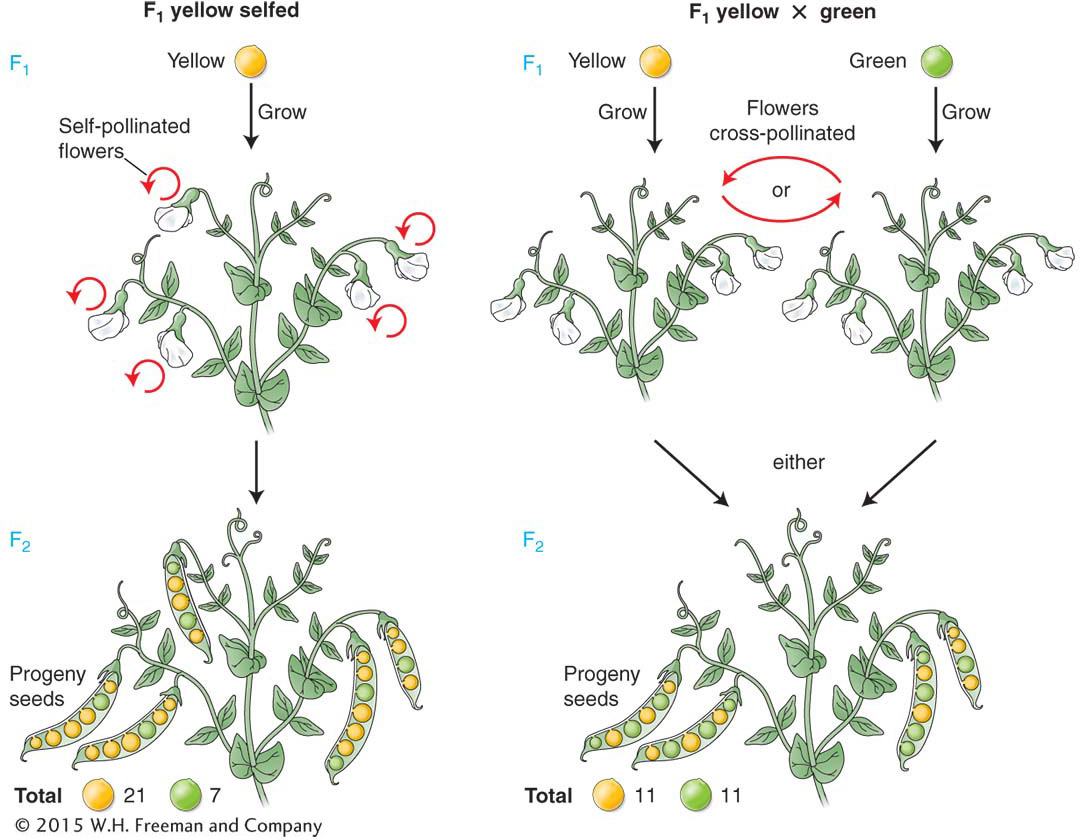
Mendel’s analysis of pea heredity made extensive use of crosses. To make a cross in plants such as the pea, pollen is simply transferred from the anthers of one plant to the stigmata of another. A special type of mating is a self (self-
female from yellow line × male from green line → F1 peas all yellow
female from green line × male from yellow line → F1 peas all yellow
The results observed in the descendants of both reciprocal crosses were the same, and so we will treat them as one cross. Mendel grew F1 peas into plants, and he selfed these plants to obtain the second filial generation, or F2. The F2 was composed of 6022 yellow peas and 2001 green peas. In summary,
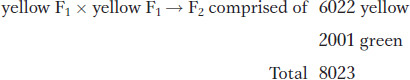
Mendel noted that this outcome was very close to a mathematical ratio of three-
To further investigate the nature of the F2 plants, Mendel selfed plants grown from the F2 seeds. He found three different types of results. The plants grown from the F2 green seeds, when selfed, were found to bear only green peas.
36
However, plants grown from the F2 yellow seeds, when selfed, were found to be of two types: one-
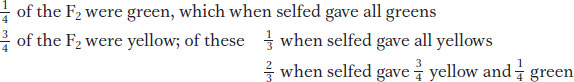
Hence, looked at another way, the F2 was comprised of
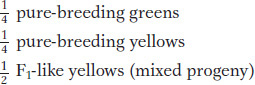
Thus, the 3:1 ratio at a more fundamental level is a 1:2:1 ratio.
Mendel made another informative cross between the F1 yellow-
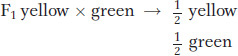
These two types of matings, the F1 self and the cross of the F1 with any green-
The 3:1 and 1:1 ratios found for pea color were also found for comparable crosses for the other six characters that Mendel studied. The actual numbers for the 3:1 ratios for those characters are shown in Table 2-1.
Mendel’s law of equal segregation
Initially, the meaning of these precise and repeatable mathematical ratios must have been unclear to Mendel, but he was able to devise a brilliant model that not only accounted for all the results, but also represented the historical birth of the science of genetics. Mendel’s model for the pea-
37
A hereditary factor called a gene is necessary for producing pea color.
Each plant has a pair of this type of gene.
The gene comes in two forms called alleles. If the gene is phonetically called a “wye” gene, then the two alleles can be represented by Y (standing for the yellow phenotype) and y (standing for the green phenotype).
A plant can be either Y/Y, y/y, or Y/y. The slash shows that the alleles are a pair.
In the Y/y plant, the Y allele dominates, and so the phenotype will be yellow. Hence, the phenotype of the Y/y plant defines the Y allele as dominant and the y allele as recessive.
In meiosis, the members of a gene pair separate equally into the cells that become eggs and sperm, the gametes. This equal separation has become known as Mendel's first law or as the law of equal segregation. Hence, a single gamete contains only one member of the gene pair.
At fertilization, gametes fuse randomly, regardless of which of the alleles they bear.
Here, we introduce some terminology. A fertilized egg, the first cell that develops into a progeny individual, is called a zygote. A plant with a pair of identical alleles is called a homozygote (adjective homozygous), and a plant in which the alleles of the pair differ is called a heterozygote (adjective heterozygous). Sometimes a heterozygote for one gene is called a monohybrid. An individual can be classified as either homozygous dominant (such as Y/Y), heterozygous (Y/y), or homozygous recessive (y/y). In genetics generally, allelic combinations underlying phenotypes are called genotypes. Hence, Y/Y, Y/y, and y/y are all genotypes.
38
|
Parental phenotypes |
F1 |
F2 |
F2 ratio |
|---|---|---|---|
|
1. round × wrinkled seeds |
All round |
5474 round; 1850 wrinkled |
2.96:1 |
|
2. yellow × green seeds |
All yellow |
6022 yellow; 2001 green |
3.01:1 |
|
3. purple × white petals |
All purple |
705 purple; 224 white |
3.15:1 |
|
4. inflated × pinched pods |
All inflated |
882 inflated; 299 pinched |
2.95:1 |
|
5. green × yellow pods |
All green |
428 green; 152 yellow |
2.82:1 |
|
6. axial × terminal flowers |
All axial |
651 axial; 207 terminal |
3.14:1 |
|
7. long × short stems |
All long |
787 long; 277 short |
2.84:1 |
Figure 2-5 shows how Mendel’s postulates explain the progeny ratios illustrated in Figure 2-4. The pure-
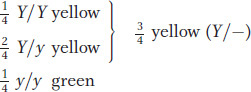
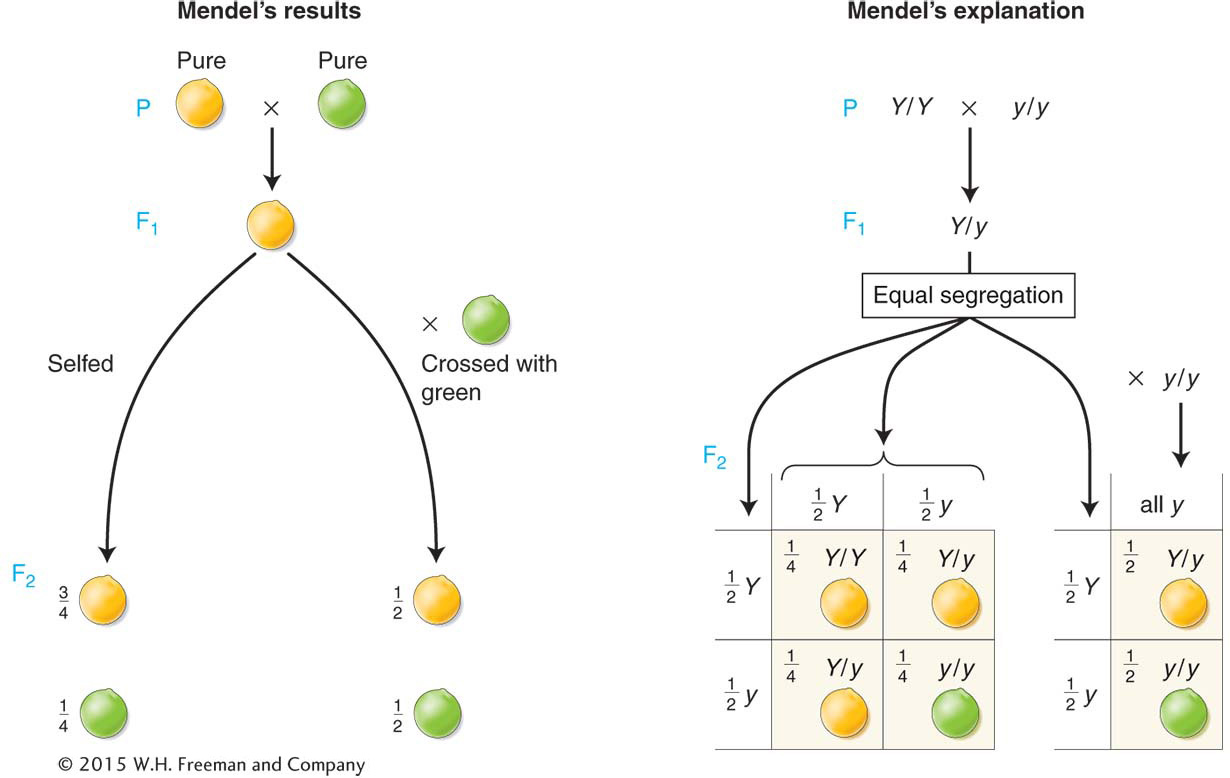
The general depiction of an individual expressing the dominant allele is Y/–; the dash represents a slot that can be filled by either another Y or a y. Note that equal segregation is detectable only in the meiosis of a heterozygote. Hence, Y/y produces one- Y :
Y nor segregation
y :
y is meaningful or detectable at the genetic level.
Y :
Y nor segregation
y :
y is meaningful or detectable at the genetic level.
We can now also explain results of the cross between the plants grown from F1 yellow seeds (Y/y) and the plants grown from green seeds (y/y). In this case, equal segregation in the yellow heterozygous F1 gives gametes with a
Y :
y ratio. The y/y parent can make only y gametes, however; so the phenotype of the progeny depends only on which allele they inherit from the Y/y parent. Thus, the
Y :
y gametic ratio from the heterozygote is converted into a
Y/y :
y/y genotypic ratio, which corresponds to a 1:1 phenotypic ratio of yellow-
39
Note that, in defining the allele pairs that underlay his phenotypes, Mendel had identified a gene that radically affects pea color. This identification was not his prime interest, but we can see how finding single-
KEY CONCEPT
All 1:1, 3:1, and 1:2:1 genetic ratios are diagnostic of single-Mendel’s research in the mid-