3.1 Mendel's Law of Independent Assortment
In much of his original work on peas, Mendel analyzed the descendants of pure lines that differed in two characters. The following general symbolism is used to represent genotypes that include two genes. If two genes are on different chromosomes, the gene pairs are separated by a semicolon—
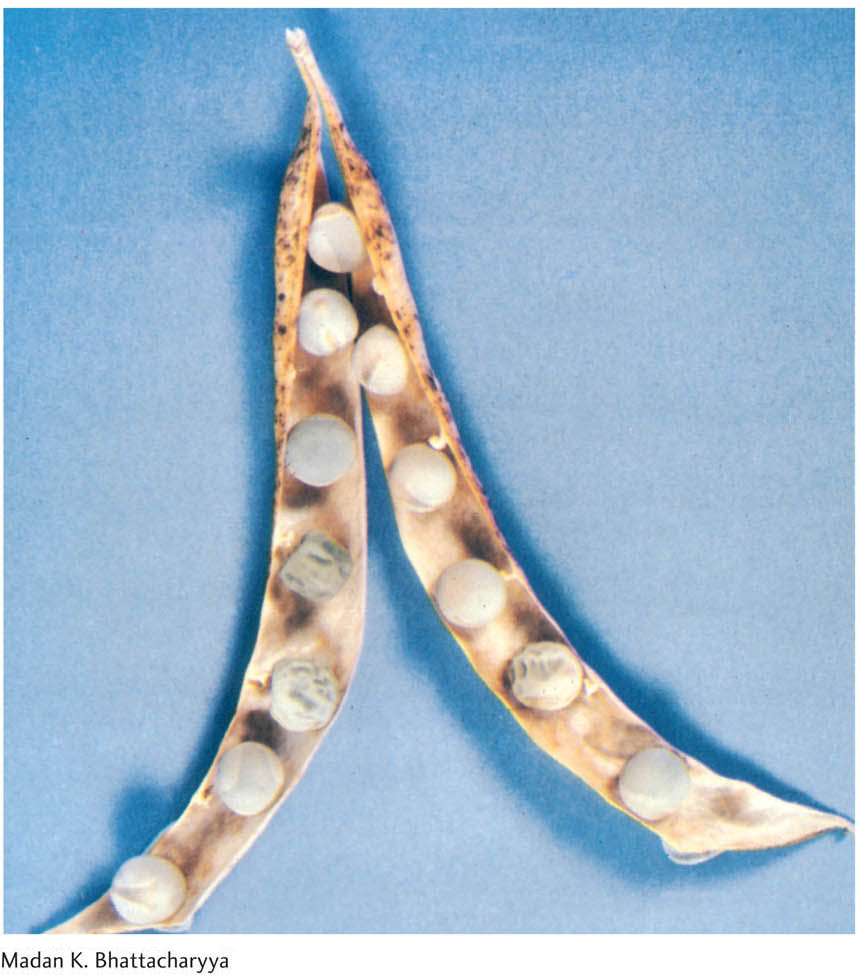
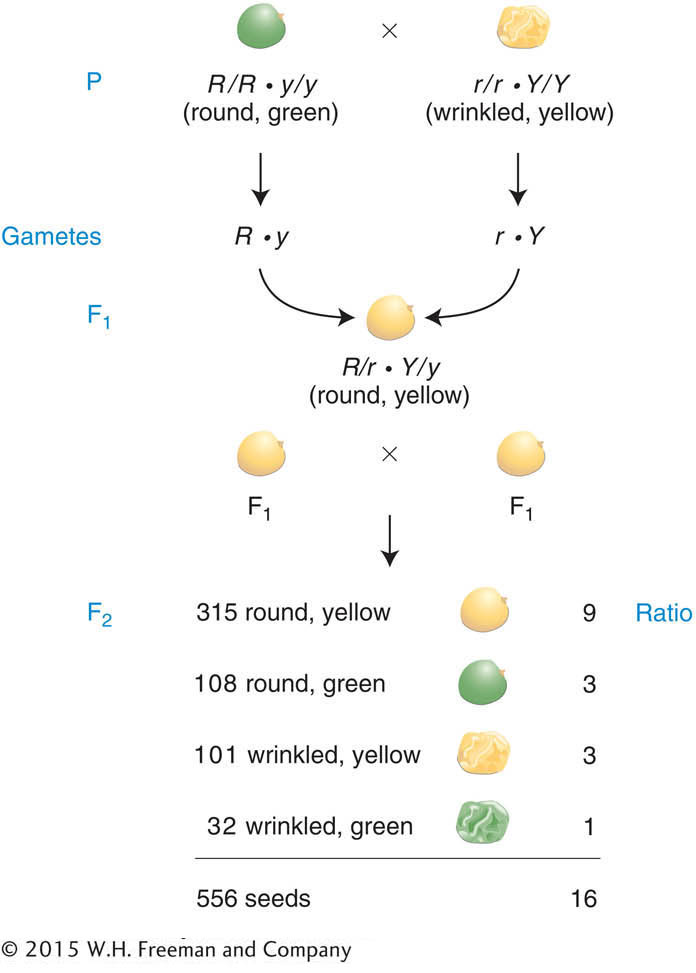
The pair of characters that he began working with were seed shape and seed color. We have already followed the monohybrid cross for seed color (Y/y × Y/y), which gave a progeny ratio of 3 yellow:1 green. The seed shape phenotypes (Figure 3-2) were round (determined by allele R) and wrinkled (determined by allele r). The monohybrid cross R/r × R/r gave a progeny ratio of 3 round:1 wrinkled as expected (see Table 2-1). To perform a dihybrid cross, Mendel started with two pure parental lines. One line had wrinkled, yellow seeds. Because Mendel had no concept of the chromosomal location of genes, we must use the dot representation to write the combined genotype initially as r/r · Y/Y. The other line had round, green seeds, with genotype R/R · y/y. When these two lines were crossed, they must have produced gametes that were r · Y and R · y, respectively. Hence, the F1 seeds had to be dihybrid, of genotype R/r · Y/y. Mendel discovered that the F1 seeds were round and yellow. This result showed that the dominance of R over r and Y over y was unaffected by the condition of the other gene pair in the R/r · Y/y dihybrid. In other words, R remained dominant over r, regardless of seed color, and Y remained dominant over y, regardless of seed shape.
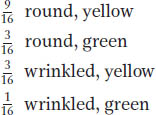
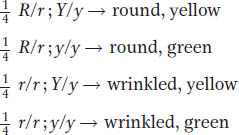
Next, Mendel selfed the dihybrid F1 to obtain the F2 generation. The F2 seeds were of four different types in the following proportions:
90
a 9:3:3:1 ratio
a result that is illustrated in Figure 3-3 with the actual numbers obtained by Mendel. This initially unexpected 9:3:3:1 ratio for these two characters seems a lot more complex than the simple 3:1 ratios of the monohybrid crosses. Nevertheless, the 9:3:3:1 ratio proved to be a consistent inheritance pattern in peas. As evidence, Mendel also made dihybrid crosses that included several other combinations of characters and found that all of the dihybrid F1 individuals produced 9:3:3:1 ratios in the F2. The ratio was another inheritance pattern that required the development of a new idea to explain it.
First, let’s check the actual numbers obtained by Mendel in Figure 3-3 to determine if the monohybrid 3:1 ratios can still be found in the F2. In regard to seed shape, there are 423 round seeds (315 + 108) and 133 wrinkled seeds (101 + 32). This result is close to a 3:1 ratio (actually 3.2:1). Next, in regard to seed color, there are 416 yellow seeds (315 + 101) and 140 green (108 + 32), also very close to a 3:1 ratio (almost exactly 3:1). The presence of these two 3:1 ratios hidden in the 9:3:3:1 ratio was undoubtedly a source of the insight that Mendel needed to explain the 9:3:3:1 ratio, because he realized that it was simply two different 3:1 ratios combined at random. One way of visualizing the random combination of these two ratios is with a branch diagram, as follows:
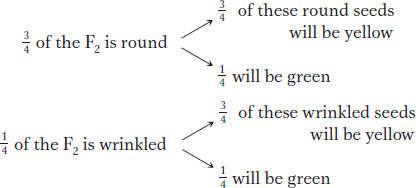
The probabilities of the four possible outcomes are calculated by using the product rule (the probability of two independent events occurring together is the product of their individual probabilities). Hence, we multiply along the branches in the diagram. For example, 3/4 of all seeds will be round, and 3/4 of the round seeds will be yellow, so the probability of a seed being both round and yellow is calculated as 3/4 × 3/4, which equals 9/16. These multiplications give the following four proportions:
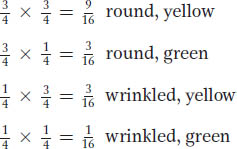
These proportions constitute the 9:3:3:1 ratio that we are trying to explain. However, is this exercise not merely number juggling? What could the combination of the two 3:1 ratios mean biologically? The way that Mendel phrased his explanation does in fact amount to a biological mechanism. In what is now known as the law of independent assortment (Mendel’s second law), he concluded that different gene pairs assort independently during gamete formation. The consequence is that, for two heterozygous gene pairs A/a and B/b, the b allele is just as likely to end up in a gamete with an a allele as with an A allele, and likewise for the B allele. In hindsight, we now know that, for the most part, this “law” applies to genes on different chromosomes. Genes on the same chromosome generally do not assort independently because they are held together by the chromosome itself.
91
KEY CONCEPT
Mendel’s second law (the principle of independent assortment) states that gene pairs on different chromosome pairs assort independently at meiosis.Mendel’s original statement of this law was that different genes assort independently because he apparently did not encounter (or he ignored) any exceptions that might have led to the concept of linkage.
We have explained the 9:3:3:1 phenotypic ratio as two randomly combined 3:1 phenotypic ratios. But can we also arrive at the 9:3:3:1 ratio from a consideration of the frequency of gametes, the actual meiotic products? Let us consider the gametes produced by the F1 dihybrid R/r; Y/y (the semicolon shows that we are now embracing the idea that the genes are on different chromosomes). Again, we will use the branch diagram to get us started because it visually illustrates independence. Combining Mendel’s laws of equal segregation and independent assortment, we can predict that
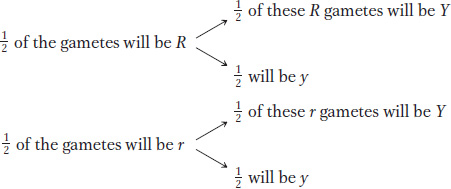
Multiplication along the branches according to the product rule gives us the gamete proportions:
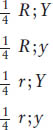
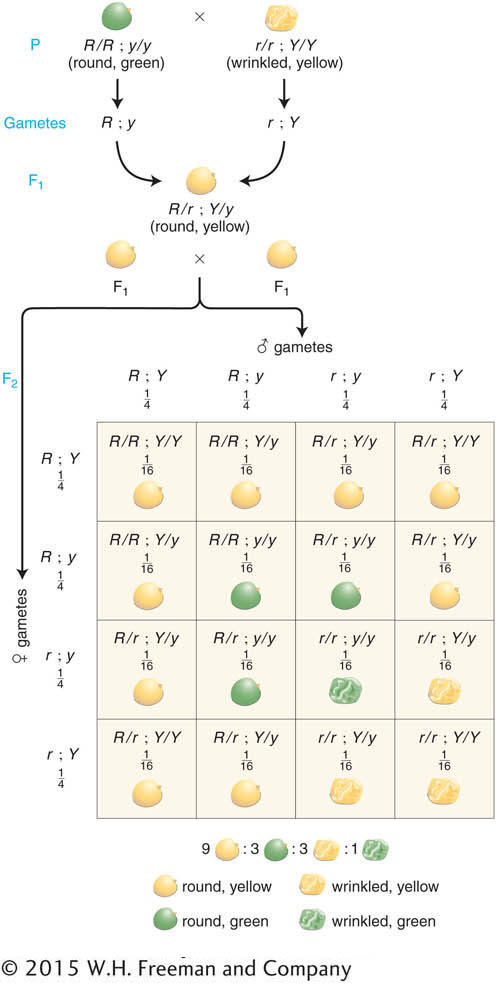
These proportions are a direct result of the application of the two Mendelian laws: of segregation and of independence. However, we still have not arrived at the 9:3:3:1 ratio. The next step is to recognize that, because male and female gametes obey the same laws during formation, both the male and the female gametes will show the same proportions just given. The four female gametic types will be fertilized randomly by the four male gametic types to obtain the F2. The best graphic way of showing the outcomes of the cross is by using a 4 × 4 grid called a Punnett square, which is depicted in Figure 3-4. We have already seen that grids are useful in genetics for providing a visual representation of the data. Their usefulness lies in the fact that their proportions can be drawn according to the genetic proportions or ratios under consideration. In the Punnett square in Figure 3-4, for example, four rows and four columns were drawn to correspond to the four genotypes of female gametes and the four of male gametes. We see that there are 16 boxes representing the various gametic fusions and that each box is 1/16th of the total area of the grid. In accord with the product rule, each 1/16th is a result of the fertilization of one egg type at frequency 1/4 by one sperm type also at frequency 1/4, giving the probability of that fusion as (1/4)2. As the Punnett square shows, the F2 contains a variety of genotypes, but there are only four phenotypes and their proportions are in the 9:3:3:1 ratio. So we see that, when we calculate progeny frequencies directly through gamete frequencies, we still arrive at the 9:3:3:1 ratio. Hence, Mendel’s laws explain not only the F2 pheno-
92
Mendel went on to test his principle of independent assortment in a number of ways. The most direct way focused on the 1:1:1:1 gametic ratio hypothesized to be produced by the F1 dihybrid R/r; Y/y, because this ratio sprang directly from his principle of independent assortment and was the biological basis of the 9:3:3:1 ratio in the F2, as shown by the Punnett square. To verify the 1:1:1:1 gametic ratio, Mendel used a testcross. He testcrossed the F1 dihybrid with a tester of genotype r/r; y/y, which produces only gametes with recessive alleles (genotype r; y). He reasoned that, if there were in fact a 1:1:1:1 ratio of R; Y, R; y, r; Y, and r; y gametes, the progeny proportions of this cross should directly correspond to the gametic proportions produced by the dihybrid; in other words,
These proportions were the result that he obtained, perfectly consistent with his expectations. He obtained similar results for all the other dihybrid crosses that he made, and these tests and other types of tests all showed that he had, in fact, devised a robust model to explain the inheritance patterns observed in his various pea crosses.
In the early 1900s, both of Mendel’s laws were tested in a wide spectrum of eukaryotic organisms. The results of these tests showed that Mendelian principles were generally applicable. Mendelian ratios (such as 3:1, 1:1, 9:3:3:1, and 1:1:1:1) were extensively reported, suggesting that equal segregation and independent assortment are fundamental hereditary processes found throughout nature. Mendel’s laws are not merely laws about peas; they are laws about the genetics of eukaryotic organisms in general.
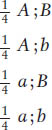
As an example of the universal applicability of the principle of independent assortment, we can examine its action in haploids. If the principle of equal segregation is valid across the board, then we should be able to observe its action in haploids, given that haploids undergo meiosis. Indeed, independent assortment can be observed in a cross of the type A; B × a; b. Fusion of parental cells results in a transient diploid meiocyte that is a dihybrid A/a; B/b, and the randomly sampled products of meiosis (sexual spores such as ascospores in fungi) will be
93
Hence, we see the same ratio as in the dihybrid testcross in a diploid organism; again, the ratio is a random combination of two monohybrid 1:1 ratios because of independent assortment.