3.3 The Chromosomal Basis of Independent Assortment
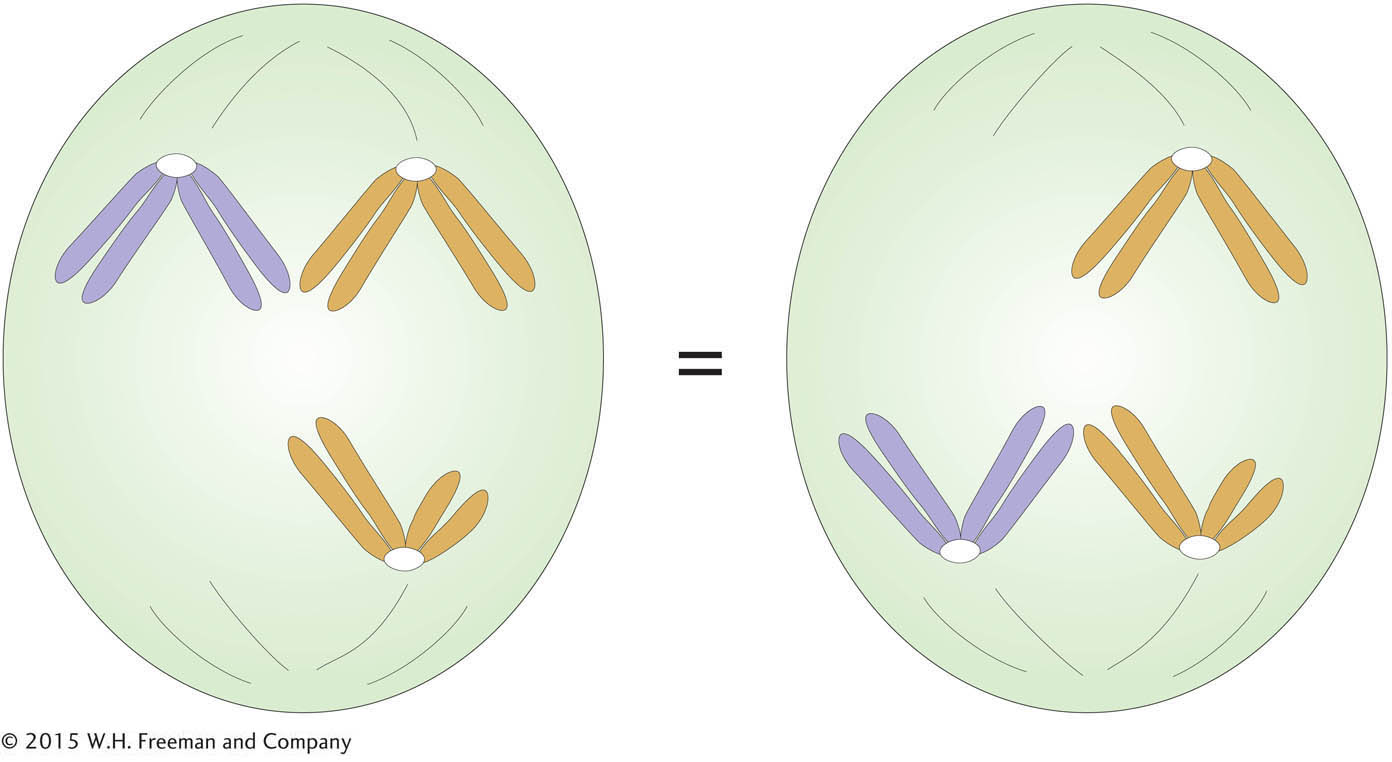
Like equal segregation, the independent assortment of gene pairs on different chromosomes is explained by the behavior of chromosomes during meiosis. Consider a chromosome that we might call number 1; its two homologs could be named 1′ and 1″. If the chromosomes align on the equator, then 1′ might go “north” and 1″ “south,” or vice versa. Similarly, for a chromosome 2 with homo-
Independent assortment is not easy to demonstrate by observing segregating chromosomes under the microscope because homologs such as 1′ and 1″ do not usually look different, although they might carry minor sequence variation. However, independent assortment can be observed in certain specialized cases. One case was instrumental in the historical development of the chromosome theory.
In 1913, Elinor Carothers found an unusual chromosomal situation in a certain species of grasshopper—
Independent assortment in diploid organisms
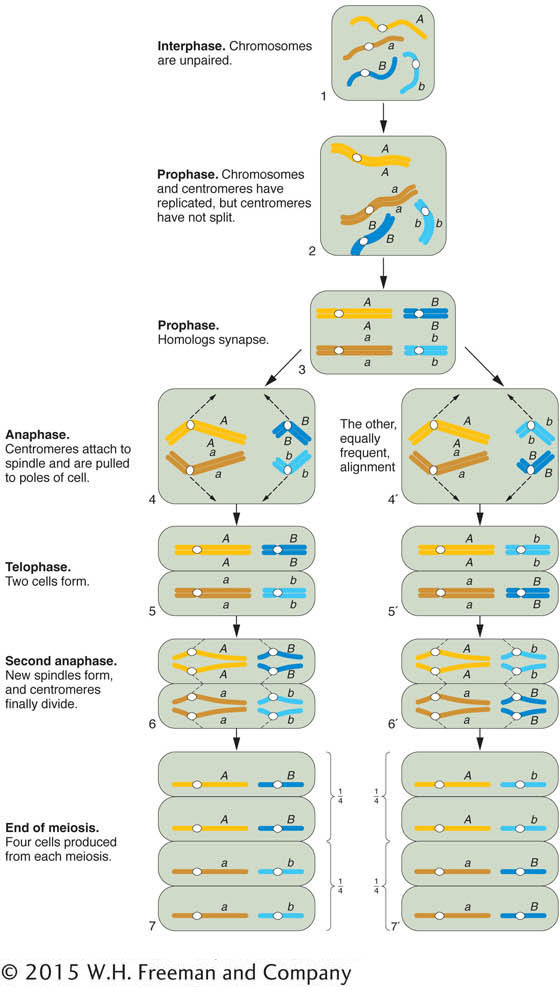
The chromosomal basis of the law of independent assortment is formally diagrammed in Figure 3-8, which illustrates how the separate behavior of two different chromosome pairs gives rise to the 1:1:1:1 Mendelian ratios of gametic types expected from independent assortment. The hypothetical cell has four chromosomes: a pair of homologous long chromosomes (yellow) and a pair of homologous short ones (blue). The genotype of the meiocytes is A/a; B/b, and the two allelic pairs, A/a and B/b, are shown on two different chromosome pairs. Parts 4 and 4′ of Figure 3-8 show the key step in independent assortment: there are two equally frequent allelic segregation patterns, one shown in 4 and the other in 4’. In one case, the A/A and B/B alleles are pulled together into one cell, and the a/a and b/b are pulled into the other cell. In the other case, the alleles A/A and b/b are united in the same cell and the alleles a/a and B/B also are united in the same cell. The two patterns result from two equally frequent spindle attachments to the centromeres in the first anaphase. Meiosis then produces four cells of the indicated genotypes from each of these segregation patterns. Because segregation patterns 4 and 4’ are equally common, the meiotic product cells of genotypes A; B, a;b, A ;b, and a; B are produced in equal frequencies. In other words, the frequency of each of the four genotypes is 1/4. This gametic distribution is that postulated by Mendel for a dihybrid, and it is the one that we inserted along one edge of the Punnett square in Figure 3-4. The random fusion of these gametes results in the 9:3:3:1 F2 phenotypic ratio.
ANIMATED ART: Meiotic recombination between unlinked genes by independent assortment
102
103
Independent assortment in haploid organisms
In the ascomycete fungi, we can actually inspect the products of a single meiocyte to show independent assortment directly. Let’s use the filamentous fungus Neurospora crassa to illustrate this point (see the Model Organism box below). As we have seen from earlier fungal examples, a cross in Neurospora is made by mixing two parental haploid strains of opposite mating type. In a manner similar to that of yeast, mating type is determined by two “alleles” of one gene—
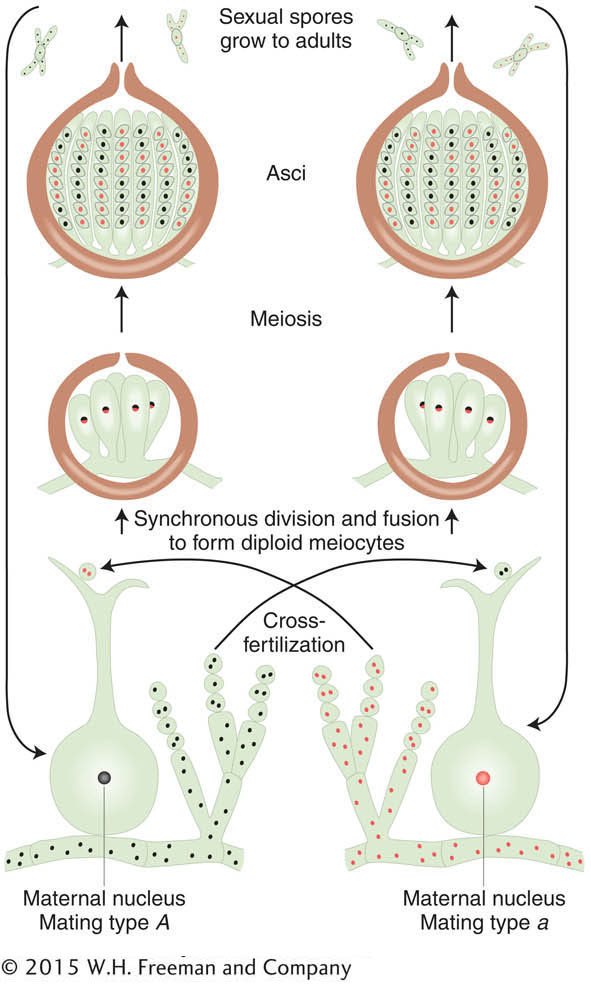
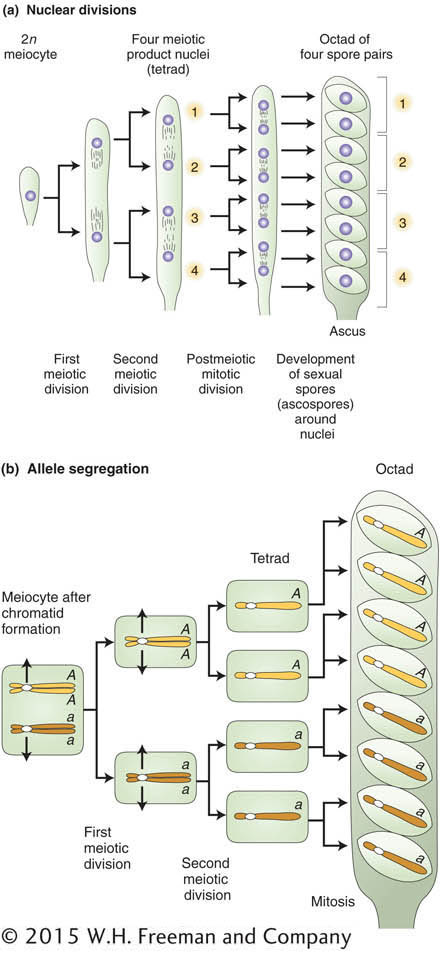
The products of meiosis in fungi are sexual spores. Recall that the ascomycetes (which include Neurospora and Saccharomyces) are unique in that, for any given meiocyte, the spores are held together in a membranous sac called an ascus. Thus, for these organisms, the products of a single meiosis can be recovered and tested. In the orange bread mold Neurospora, the nuclear spindles of meioses I and II do not overlap within the cigar-
Now we can examine a dihybrid. Let’s make a cross between two distinct mutants having mutations in different genes on different chromosomes. By assuming that the loci of the mutated genes are both very close to their respective centromeres, we avoid complications due to crossing over between the loci and the centromeres. The first mutant is albino (a), contrasting with the normal pink wild type (a+). The second mutant is biscuit (b), which has a very compact colony shaped like a biscuit in contrast with the flat, spreading colony of wild type (b+). We will assume that the two mutants are of opposite mating type. Hence, the cross is
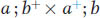
Because of random spindle attachment, the following two octad types will be equally frequent:
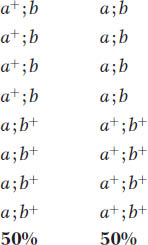
The equal frequency of these two types is a convincing demonstration of independent assortment occurring in individual meiocytes.
104
Independent assortment of combinations of autosomal and X-linked genes
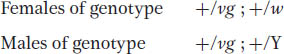
The principle of independent assortment is also useful in analyzing genotypes that are heterozygous for both autosomal and X-

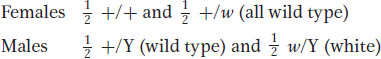
The F1 will be:
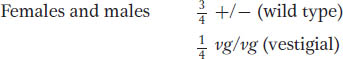
These F1 flies must be interbred to obtain an F2. Because the cross is a monohybrid cross for the autosomal vestigial gene, both sexes of the F2 will show
For the X-
If the autosomal and X-
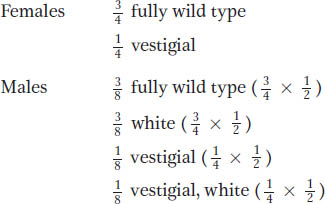
Hence, we see a progeny ratio that reveals clear elements of both autosomal and X-
Recombination
The independent assortment of genes at meiosis is one of the main ways by which an organism produces new combinations of alleles. The production of new allele combinations is formally called recombination.
105
Neurospora
Neurospora crassa was one of the first eukaryotic microbes to be adopted by geneticists as a model organism. It is a haploid fungus (n = 7) found growing on dead vegetation in many parts of the world. When an asexual spore (haploid) germinates, it produces a tubular structure that extends rapidly by tip growth and throws off multiple side branches. The result is a mass of branched threads (called hyphae), which constitute a colony. Hyphae have no cross-
Asexual colonies are easily and inexpensively maintained in the laboratory on a defined medium of inorganic salts plus an energy source such as sugar. (An inert gel such as agar is added to provide a firm surface.) The fact that Neurospora can chemically synthesize all its essential molecules from such a simple medium led biochemical geneticists (beginning with George Beadle and Edward Tatum; see Chapter 6) to choose it for studies of synthetic pathways. Geneticists worked out the steps in these pathways by introducing mutations and observing their effects. The haploid state of Neurospora is ideal for such mutational analysis because mutant alleles are always expressed directly in the phenotype.
Neurospora has two mating types, MAT-

There is general agreement that the evolutionary advantage of producing new combinations of alleles is that it provides variation as the raw material for natural selection. Recombination is a crucial principle in genetics, partly because of its relevance to evolution but also because of its use in genetic analysis. It is particularly useful for analyzing inheritance patterns of multigene genotypes. In this section, we define recombination in such a way that we would recognize it in experimental results, and we lay out the way in which recombination is analyzed and interpreted.
Recombination is observed in a variety of biological situations, but, for the present, we define it in relation to meiosis.
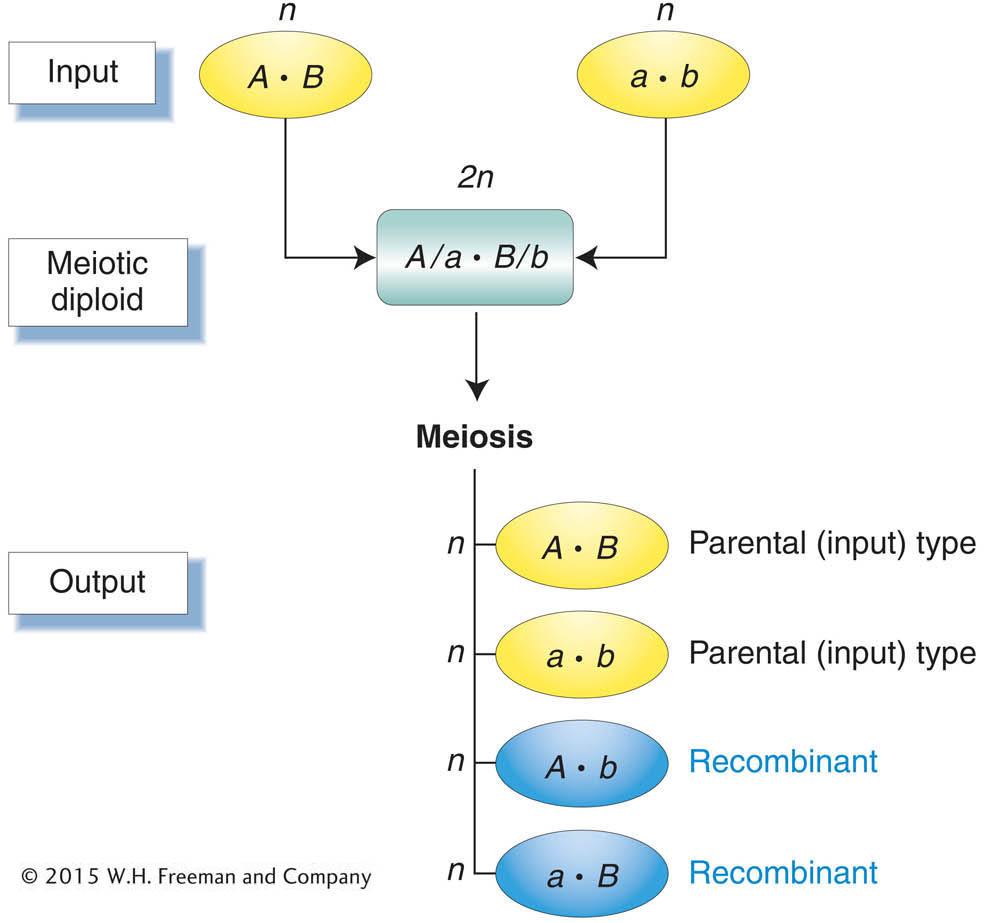
Meiotic recombination is any meiotic process that generates a haploid product with new combinations of the alleles carried by the haploid genotypes that united to form the meiocyte.
106
This seemingly wordy definition is actually quite simple; it makes the important point that we detect recombination by comparing the inputs into meiosis with the outputs (Figure 3-11). The inputs are the two haploid genotypes that combine to form the meiocyte, the diploid cell that undergoes meiosis. For humans, the inputs are the parental egg and sperm. They unite to form a diploid zygote, which divides to yield all the body cells, including the meiocytes that are set aside within the gonads. The output genotypes are the haploid products of meiosis. In humans, these haploid products are a person’s own eggs or sperm. Any meiotic product that has a new combination of the alleles provided by the two input genotypes is by definition a recombinant.
KEY CONCEPT
Meiosis generates recombinants, which are haploid meiotic products with new combinations of the alleles carried by the haploid genotypes that united to form the meiocyte.First, let us look at how recombinants are detected experimentally. The detection of recombinants in organisms with haploid life cycles such as fungi or algae is straightforward. The input and output types in haploid life cycles are the genotypes of individuals rather than gametes and may thus be inferred directly from phenotypes. Figure 3-11 can be viewed as summarizing the simple detection of recombinants in organisms with haploid life cycles. Detecting recombinants in organisms with diploid life cycles is trickier. The input and output types in diploid cycles are gametes. Thus, we must know the genotypes of both input and output gametes to detect recombinants in an organism with a diploid cycle. Though we cannot detect the genotypes of input or output gametes directly, we can infer these genotypes by using the appropriate techniques:
107
To know the input gametes, we use pure-
breeding diploid parents because they can produce only one gametic type. To detect recombinant output gametes, we testcross the diploid individual and observe its progeny (Figure 3-12).
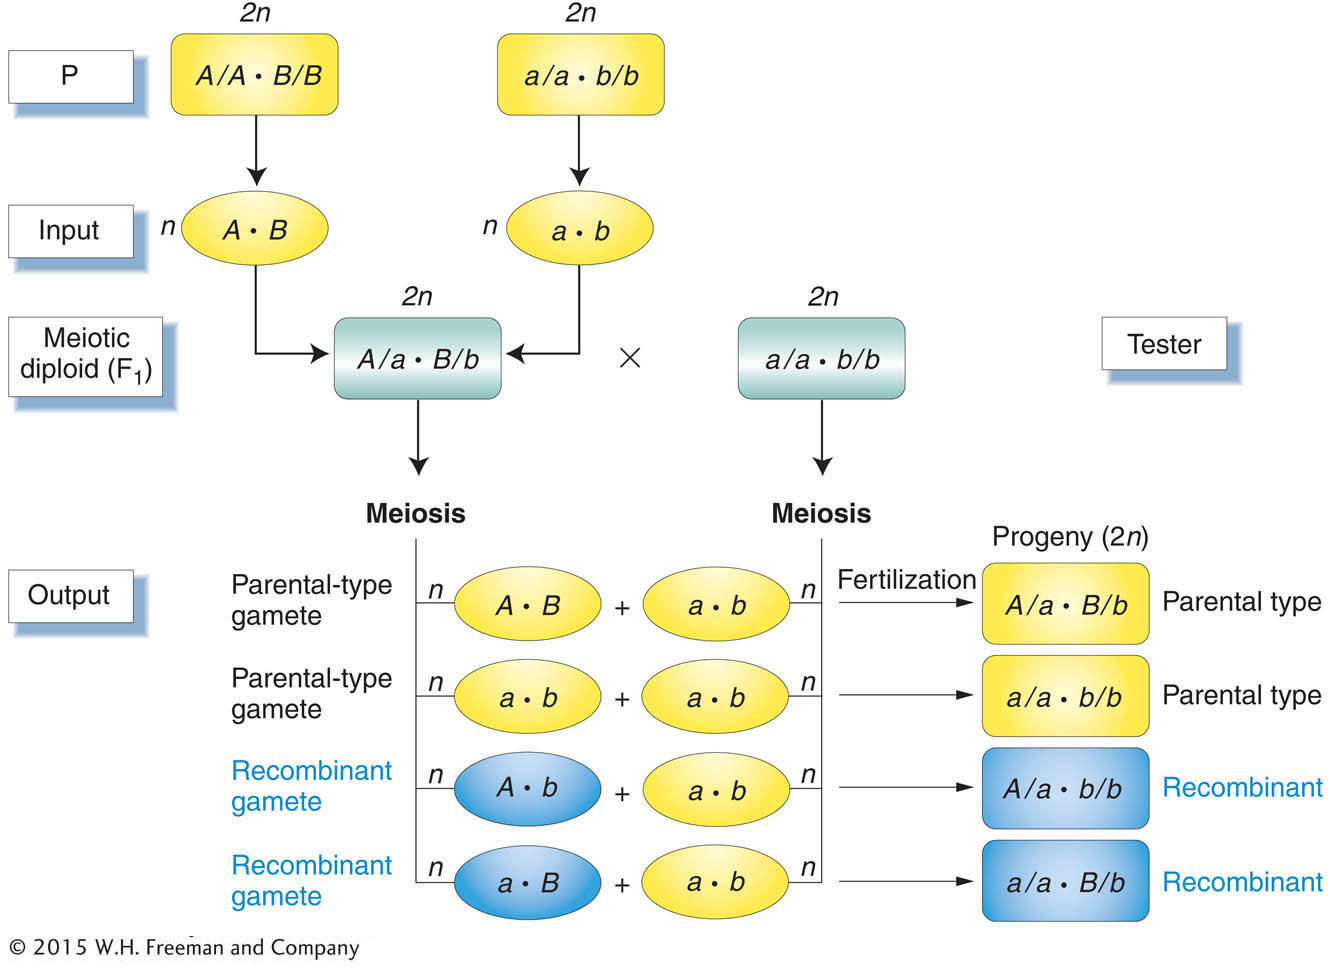
A testcross offspring that arises from a recombinant product of meiosis also is called a recombinant. Notice, again, that the testcross allows us to concentrate on one meiosis and prevent ambiguity. From a self of the F1 in Figure 3-12 for example, a recombinant A/A · B/b offspring could not be distinguished from A/A · B/B without further crosses.
A central part of recombination analysis is recombinant frequency. One reason for focusing on recombinant frequency is that its numerical value is a convenient test for whether two genes are on different chromosomes. Recombinants are produced by two different cellular processes: the independent assortment of genes on different chromosomes (this chapter) and crossing over between genes on the same chromosome (see Chapter 4). The proportion of recombinants is the key idea here because the diagnostic value can tell us whether genes are on different chromosomes. We will deal with independent assortment here.
For genes on separate chromosomes, recombinants are produced by independent assortment, as shown in Figure 3-13. Again, we see the 1:1:1:1 ratio that we have seen before, but now the progeny of the testcross are classified as either recombinant or resembling the P (parental) input types. Set up in this way, the proportion of recombinants is clearly 
 , or 50 percent of the total progeny. Hence, we see that independent assortment at meiosis produces a recombinant frequency of 50 percent. If we observe a recombinant frequency of 50 percent in a testcross, we can infer that the two genes under study assort independently. The simplest and most likely interpretation of independent assortment is that the two genes are on separate chromosome pairs. (However, we must note that genes that are very far apart on the same chromosome pair can assort virtually independently and produce the same result; see Chapter 4.)
KEY CONCEPT
A recombinant frequency of 50 percent indicates that the genes are independently assorting and are most likely on different chromosomes.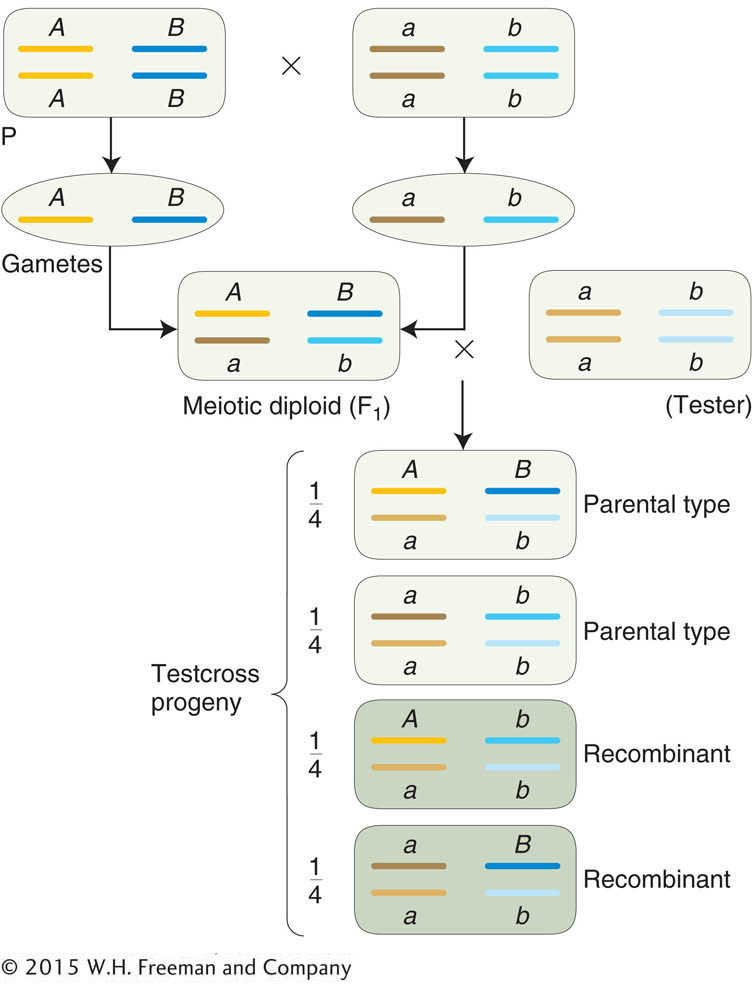
ANIMATED ART: Meiotic recombination between unlinked genes by independent assortment
108