SOLVED PROBLEMS
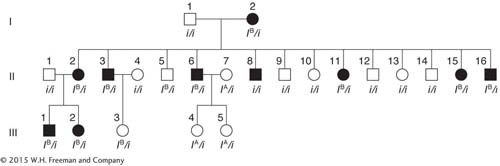
SOLVED PROBLEM 1. A human pedigree shows people affected with the rare nail–
Is the nail–
patella syndrome a dominant or recessive phenotype? Give reasons to support your answer. Is there evidence of linkage between the nail–
patella gene and the gene for ABO blood type, as judged from this pedigree? Why or why not? If there is evidence of linkage, then draw the alleles on the relevant homologs of the grandparents. If there is no evidence of linkage, draw the alleles on two homologous pairs.
According to your model, which generation II descendants are recombinants?
What is the best estimate of RF?
If man III-
1 marries a normal woman of blood type O, what is the probability that their first child will be blood type B with nail– patella syndrome?
159
Solution
Nail–
patella syndrome is most likely dominant. We are told that it is a rare abnormality, and so the unaffected people marrying into the family are unlikely to carry a presumptive recessive allele for nail– patella syndrome. Let N be the causative allele. Then all people with the syndrome are heterozygotes N/n because all (probably including the grandmother) result from matings with n/n normal people. Notice that the syndrome appears in all three generations— another indication of dominant inheritance. There is evidence of linkage. Notice that most of the affected people—
those who carry the N allele— also carry the IB allele; most likely, these alleles are linked on the same chromosome. 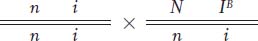
(The grandmother must carry both recessive alleles to produce offspring of genotype i/i and n/n.)
Notice that the grandparental mating is equivalent to a testcross; so the recombinants in generation II are
II-
5:n IB/n i and II- 8: N i/n i whereas all others are nonrecombinants, being either N IB/n i or n i/n i.
Notice that the grandparental cross and the first two crosses in generation II are identical and are testcrosses. Three of the total 16 progeny are recombinant (II-
5, II- 8, and III- 3). The cross of II- 6 with II- 7 is not a testcross, but the chromosomes donated from II- 6 can be deduced to be nonrecombinant. Thus, RF = 3/18, which is 17 percent 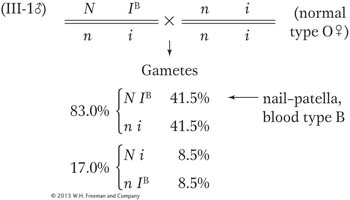
The two parental classes are always equal, and so are the two recombinant classes. Hence, the probability that the first child will have nail–
patella syndrome and blood type B is 41.5 percent.
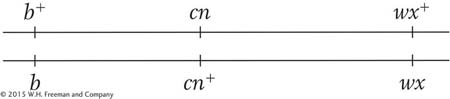
SOLVED PROBLEM 2. The allele b gives Drosophila flies a black body, and b+ gives brown, the wild-
Explain these numbers.
Draw the alleles in their proper positions on the chromosomes of the triple heterozygote.
If appropriate according to your explanation, calculate interference.
Solution
a. A general piece of advice is to be methodical. Here, it is a good idea to write out the genotypes that may be inferred from the phenotypes. The cross is a testcross of type

Notice that there are distinct pairs of progeny classes in regard to frequency. Already, we can guess that the two largest classes represent parental chromosomes, that the two classes of about 68 represent single crossovers in one region, that the two classes of about 45 represent single crossovers in the other region, and that the two classes of about 5 represent double crossovers. We can write out the progeny as classes derived from the female’s gametes, grouped as follows:
|
b+ · wx+ · cn |
382 |
|
b · wx · cn+ |
379 |
|
b+− wx · cn |
69 |
|
b · wx+ · cn+ |
67 |
|
b+ · wx · cn+ |
48 |
|
b · wx+ · cn |
44 |
|
b · wx · cn |
6 |
|
b+ · wx+ · cn+ |
5 |
|
|
1000 |
Listing the classes in this way confirms that the pairs of classes are in fact reciprocal genotypes arising from zero, one, or two crossovers.
At first, because we do not know the parents of the triple heterozygous female, it looks as if we cannot apply the definition of recombination in which gametic genotypes are compared with the two parental genotypes that form an individual fly. But, on reflection, the only parental types that make sense in regard to the data presented are b+/b+ · wx+/wx+ · cn/cn+ and b/b · wx/wx · cn+/cn+ because these types represent the most common gametic classes.
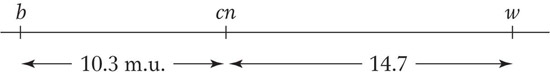
Now, we can calculate the recombinant frequencies. For b-
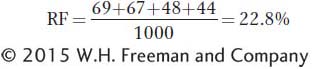
For b-cn,
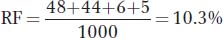
160
and for wx-
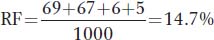
The map is therefore
b. The parental chromosomes in the triple heterozygote are
c. The expected number of double recombinants is 0.103 × 0.147 × 1000 = 15.141. The observed number is 6 + 5 = 11, and so interference can be calculated as
I = 1 – (11/15.141) = 1 – 0.726 = 0.274 = 27.4%
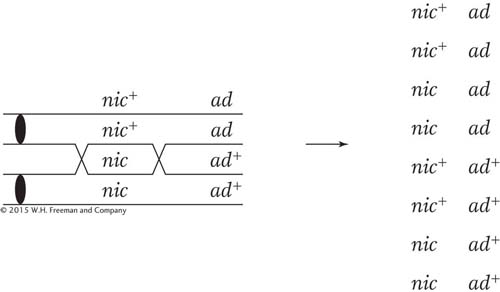
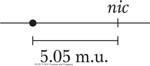
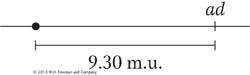
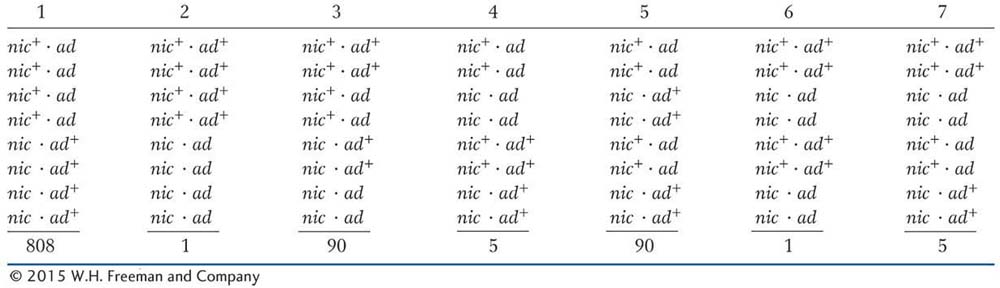
SOLVED PROBLEM 3. A cross is made between a haploid strain of Neurospora of genotype nic+ ad and another haploid strain of genotype nic ad+. From this cross, a total of 1000 linear asci are isolated and categorized as in the table below. Map the ad and nic loci in relation to centromeres and to each other.
Solution
What principles can we draw on to solve this problem? It is a good idea to begin by doing something straightforward, which is to calculate the two locus-
Remember that an MII pattern is any pattern that is not two blocks of four. Let’s start with the distance between the nic locus and the centromere. All we have to do is add the ascus types 4, 5, 6, and 7, because all of them are MII patterns for the nic locus. The total is 5 + 90 + 1 + 5 = 101 of 1000, or 10.1 percent. In this chapter, we have seen that to convert this percentage into map units, we must divide by 2, which gives 5.05 m.u.
We do the same for the ad locus. Here, the total of the MII patterns is given by types 3, 5, 6, and 7 and is 90 + 90 + 1 + 5 = 186 of 1000, or 18.6 percent, which is 9.3 m.u.
Now we have to put the two together and decide between the following alternatives, all of which are compatible with the preceding locus-
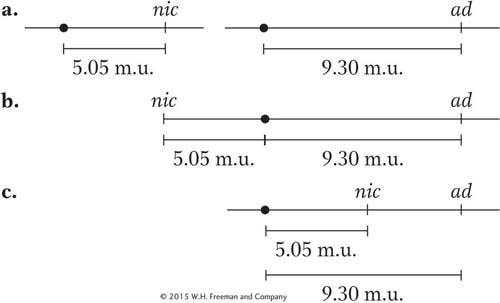
Here, a combination of common sense and simple analysis tells us which alternative is correct. First, an inspection of the asci reveals that the most common single type is the one labeled 1, which contains more than 80 percent of all the asci. This type contains only nic+ · ad and nic · ad + genotypes, and they are parental genotypes. So we know that recombination is quite low and the loci are certainly linked. This rules out alternative a.
Now consider alternative c. If this alternative were correct, a crossover between the centromere and the nic locus would generate not only an MII pattern for that locus, but also an MII pattern for the ad locus, because it is farther from the centromere than nic is. The ascus pattern produced by a crossover between nic and the centromere in alternative c should be
161
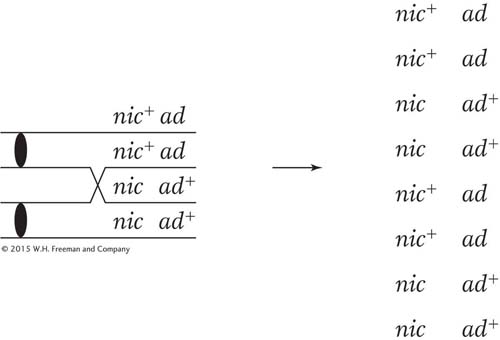
Remember that the nic locus shows MII patterns in asci types 4, 5, 6, and 7 (a total of 101 asci); of them, type 5 is the very one that we are talking about and contains 90 asci. Therefore, alternative c appears to be correct because ascus type 5 comprises about 90 percent of the MII asci for the nic locus. This relation would not hold if alternative b were correct because crossovers on either side of the centromere would generate the MII patterns for the nic and the ad loci independently.
Is the map distance from nic to ad simply 9.30 − 5.05 = 4.25 m.u.? Close, but not quite. The best way of calculating map distances between loci is always by measuring the recombinant frequency. We could go through the asci and count all
the recombinant ascospores, but using the formula  + NPD is simpler. The T asci are classes 3, 4, and 7, and the NPD asci are classes 2 and 6. Hence,
 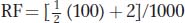 = 5.2 percent, or 5.2 m.u., and a better map is
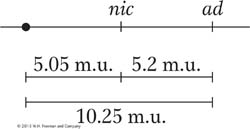
The reason for the underestimation of the ad-to-