4.1 Diagnostics of Linkage
Recombination maps of chromosomes are usually assembled two or three genes at a time, with the use of a method called linkage analysis. When geneticists say that two genes are linked, they mean that the loci of those genes are on the same chromosome, and, hence, the alleles on any one homolog are physically joined (linked) by the DNA between them. The way in which early geneticists deduced linkage is a useful means of introducing most of the key ideas and procedures in the analysis.
Using recombinant frequency to recognize linkage
In the early 1900s, William Bateson and R. C. Punnett (for whom the Punnett square was named) were studying the inheritance of two genes in sweet peas. In a standard self of a dihybrid F1, the F2 did not show the 9:3:3:1 ratio predicted by the principle of independent assortment. In fact, Bateson and Punnett noted that certain combinations of alleles showed up more often than expected, almost as though they were physically attached in some way. However, they had no explanation for this discovery.
130
Later, Thomas Hunt Morgan found a similar deviation from Mendel’s second law while studying two autosomal genes in Drosophila. Morgan proposed linkage as a hypothesis to explain the phenomenon of apparent allele association.
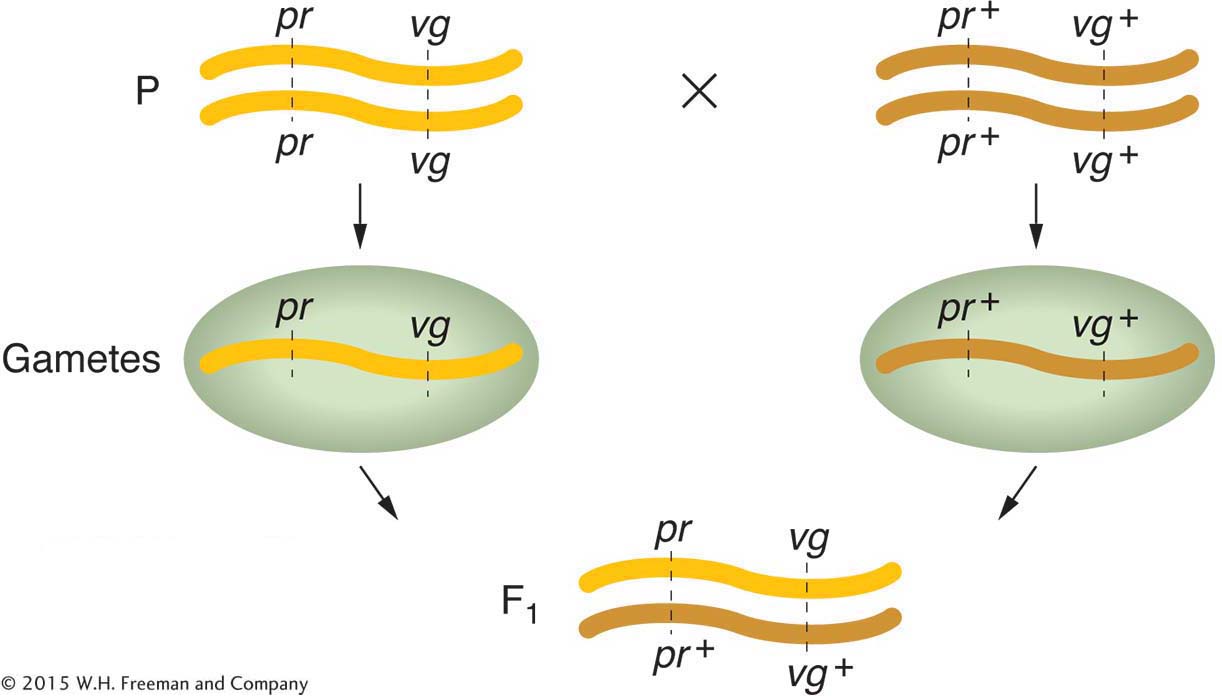
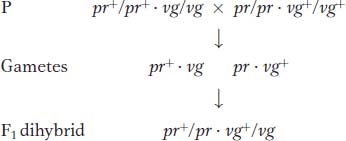
Let’s look at some of Morgan’s data. One of the genes affected eye color (pr, purple, and pr+, red), and the other gene affected wing length (vg, vestigial, and vg+, normal). (Vestigial wings are very small compared to wild type.) The wild-
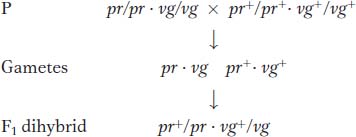
Testcross:
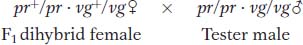
Morgan’s use of the testcross is important. Because the tester parent contributes gametes carrying only recessive alleles, the phenotypes of the offspring directly reveal the alleles contributed by the gametes of the dihybrid parent, as described in Chapters 2 and 3. Hence, the analyst can concentrate on meiosis in one parent (the dihybrid) and essentially forget about meiosis in the other (the tester). In contrast, from an F1 self, there are two sets of meioses to consider in the analysis of progeny: one in the male parent and the other in the female.
Morgan’s testcross results were as follows (listed as the gametic classes from the dihybrid):
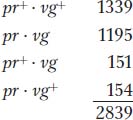
Obviously, these numbers deviate drastically from the Mendelian prediction of a 1:1:1:1 ratio expected from independent assortment (approximately 710 in each of the four classes). In Morgan’s results, we see that the first two allele combinations are in the great majority, clearly indicating that they are associated, or “linked.”
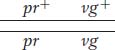
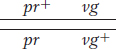
Another useful way of assessing the testcross results is by considering the percentage of recombinants in the progeny. By definition, the recombinants in the present cross are the two types pr+ · vg and pr·vg+ because they are clearly not the two input genotypes contributed to the F1 dihybrid by the original homozygous parental flies (more precisely, by their gametes). We see that the two recombinant types are approximately equal in frequency (151 ~ 154). Their total is 305, which is a frequency of (305/2839) × 100, or 10.7 percent. We can make sense of these data, as Morgan did, by postulating that the genes were linked on the same chromosome, and so the parental allelic combinations are held together in the majority of progeny. In the dihybrid, the allelic conformation must have been as follows:
131
The tendency of linked alleles to be inherited as a package is illustrated in Figure 4-2.
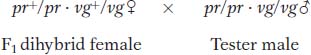
Now let’s look at another cross that Morgan made with the use of the same alleles but in a different combination. In this cross, each parent is homozygous for the wild-
Testcross:
The following progeny were obtained from the testcross:
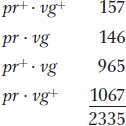
Again, these results are not even close to a 1:1:1:1 Mendelian ratio. Now, however, the recombinant classes are the converse of those in the first analysis, pr+ vg+ and pr vg. But notice that their frequency is approximately the same: (157 + 146)/2335 × 100 = 12.9 percent. Again, linkage is suggested, but, in this case, the F1 dihybrid must have been as follows:
Dihybrid testcross results like those just presented are commonly encountered in genetics. They follow the general pattern:
Two equally frequent nonrecombinant classes totaling in excess of 50 percent
Two equally frequent recombinant classes totaling less than 50 percent
132
KEY CONCEPT
When two genes are close together on the same chromosome. pair (that is, they are linked), they do not assort independently but produce a recombinant frequency of less than 50 percent. Hence, conversely, a recombinant frequency of less than 50 percent is a diagnostic for linkage.How crossovers produce recombinants for linked genes
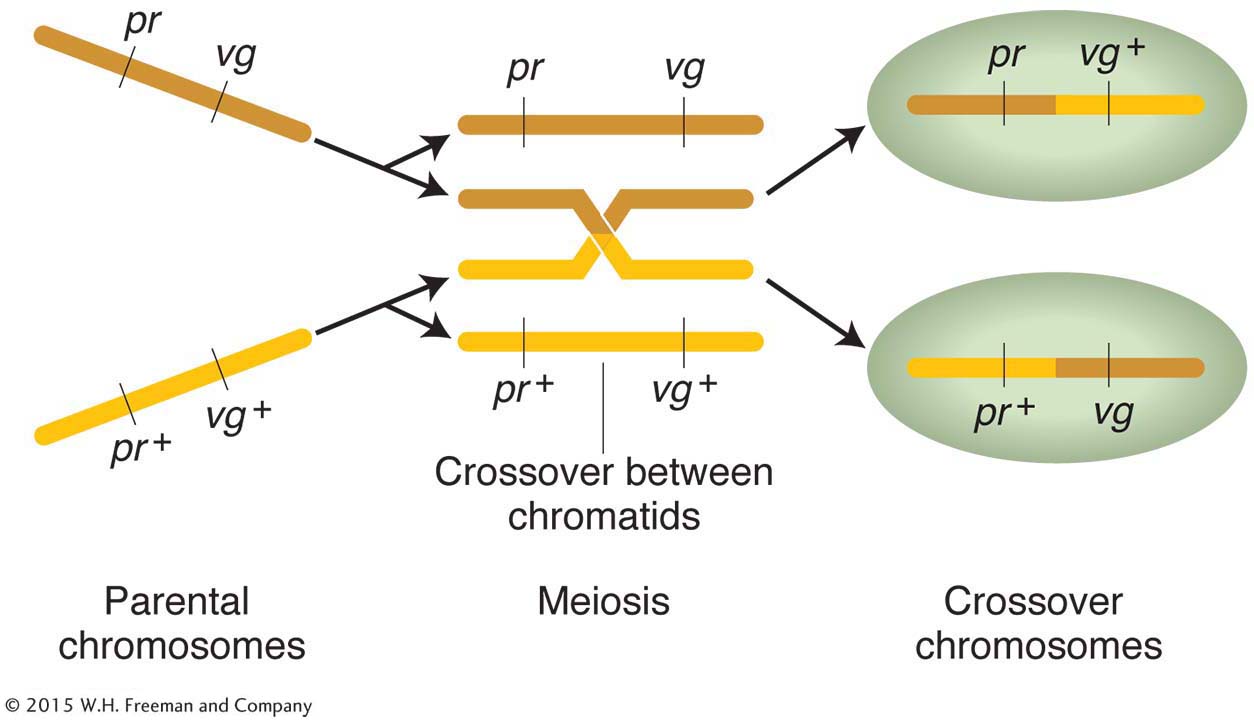
The linkage hypothesis explains why allele combinations from the parental generations remain together: the genes are physically attached by the segment of chromosome between them. But exactly how are any recombinants produced when genes are linked? Morgan suggested that, when homologous chromosomes pair at meiosis, the chromosomes occasionally break and exchange parts in a process called crossing over. Figure 4-3 illustrates this physical exchange of chromosome segments. The two new combinations are called crossover products.
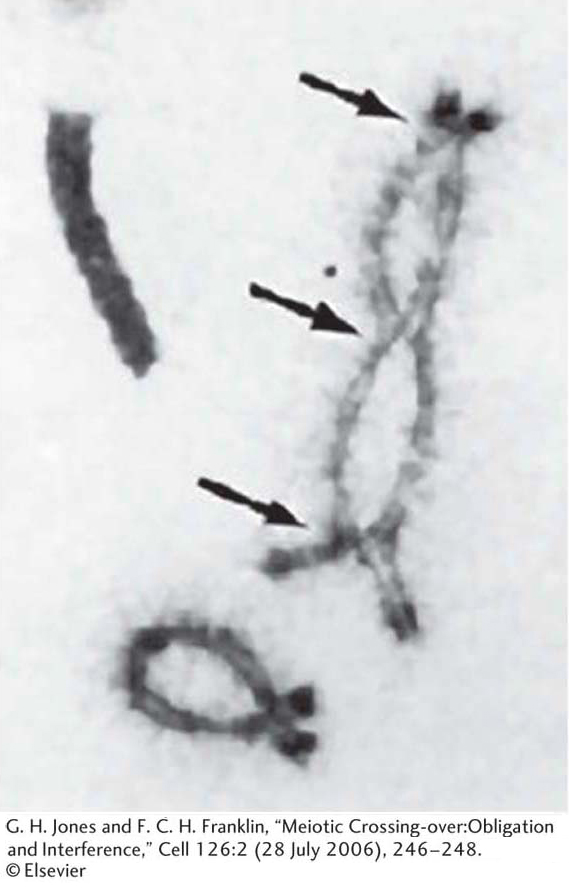
Is there any microscopically observable process that could account for crossing over? At meiosis, when duplicated homologous chromosomes pair with each other—
KEY CONCEPT
For linked genes, recombinants are produced by crossovers. Chiasmata are the visible manifestations of crossovers.Linkage symbolism and terminology
The work of Morgan showed that linked genes in a dihybrid may be present in one of two basic conformations. In one, the two dominant, or wild-
|
Cis |
AB/ab or + +/ab |
|
Trans |
Ab/aB or + b/a + |
Note the following conventions that pertain to linkage symbolism:
Alleles on the same homolog have no punctuation between them.
A slash symbolically separates the two homologs.
Alleles are always written in the same order on each homolog.
As in earlier chapters, genes known to be on different chromosomes (unlinked genes) are shown separated by a semicolon—
for example, A/a; C/c. In this book, genes of unknown linkage are shown separated by a dot, A/a · D/d.
133
Evidence that crossing over is a breakage-and-rejoining process
The idea that recombinants are produced by some kind of exchange of material between homologous chromosomes was a compelling one. But experimentation was necessary to test this hypothesis. A first step was to find a case in which the exchange of parts between chromosomes would be visible under the microscope. Several investigators approached this problem in the same way, and one of their analyses follows.
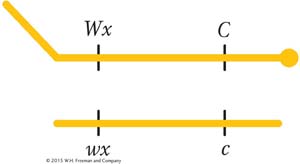
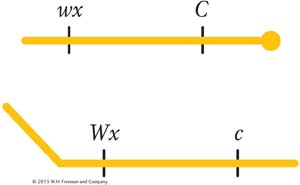
In 1931, Harriet Creighton and Barbara McClintock were studying two genes of corn that they knew were both located on chromosome 9. One affected seed color (C, colored; c, colorless), and the other affected endosperm composition (Wx, waxy; wx, starchy). The plant was a dihybrid in cis conformation. However, in one plant, the chromosome 9 carrying the alleles C and Wx was unusual in that it also carried a large, densely staining element (called a knob) on the C end and a longer piece of chromosome on the Wx end; thus, the heterozygote was
In the progeny of a testcross of this plant, they compared recombinants and parental genotypes. They found that all the recombinants inherited one or the other of the two following chromosomes, depending on their recombinant makeup:
Thus, there was a precise correlation between the genetic event of the appearance of recombinants and the chromosomal event of crossing over. Consequently, the chiasmata appeared to be the sites of exchange, although what was considered to be the definitive test was not undertaken until 1978.
What can we say about the molecular mechanism of chromosome exchange in a crossover event? The short answer is that a crossover results from the breakage and reunion of DNA. Two parental chromosomes break at the same position, and then each piece joins up with the neighboring piece from the other chromosome. In Section 4.8, we will see a model of the molecular processes that allow DNA to break and rejoin in a precise manner such that no genetic material is lost or gained.
KEY CONCEPT
A crossover is the breakage of two DNA molecules at the same position and their rejoining in two reciprocal recombinant combinations.Evidence that crossing over takes place at the four-chromatid stage
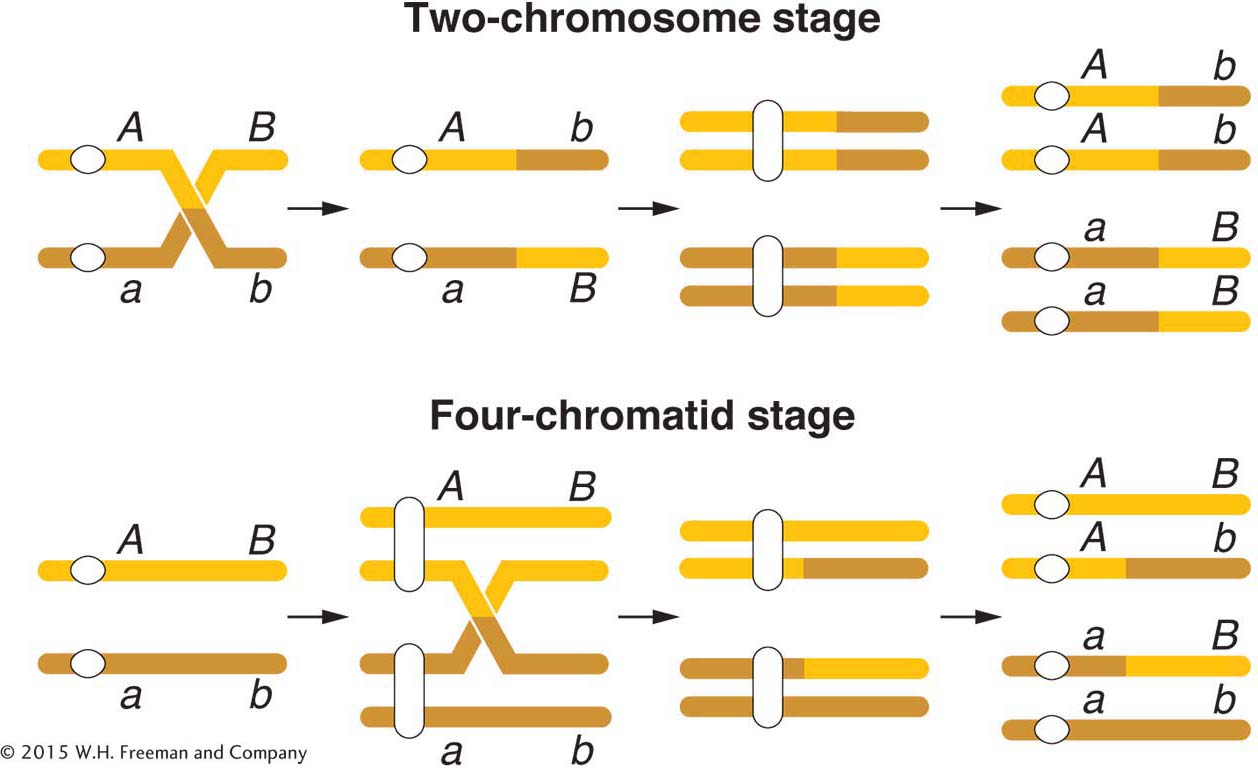
As already noted, the diagrammatic representation of crossing over in Figure 4-3 shows a crossover taking place at the four-
134
AB × ab
some (but not all) tetrads contain four genotypes:
AB
Ab
aB
ab
This result can be explained only if crossovers take place at the four-
Multiple crossovers can include more than two chromatids
Tetrad analysis can also show two other important features of crossing over. First, in some individual meiocytes, several crossovers can occur along a chromosome pair. Second, in any one meiocyte, these multiple crossovers can exchange material between more than two chromatids. To think about this matter, we need to look at the simplest case: double crossovers. To study double crossovers, we need three linked genes. For example, if the three loci are all linked in a cross such as
ABC × abc
many different tetrad types are possible, but some types are informative in the present connection because they can be accounted for only by double crossovers in which more than two chromatids take part. Consider the following tetrad as an example:
ABc
AbC
aBC
abc
This tetrad must be explained by two crossovers in which three chromatids take part, as shown in Figure 4-6a. Furthermore, the following type of tetrad shows that all four chromatids can participate in crossing over in the same meiosis (Figure 4-6b):
ABc
Abc
aBC
abC
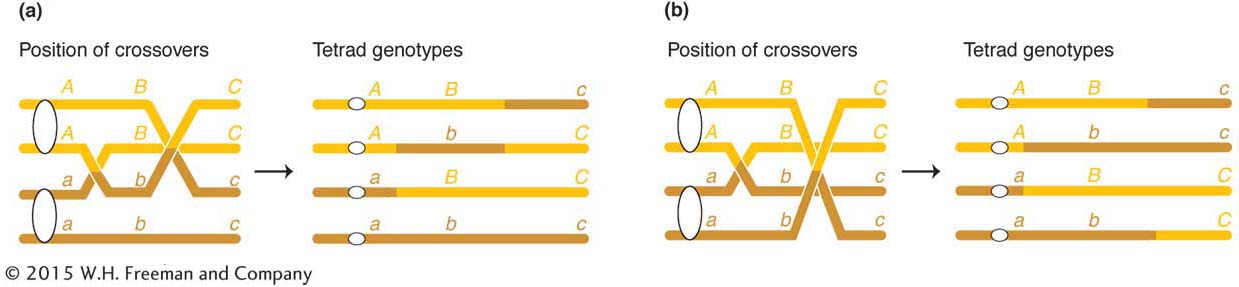
Therefore, for any pair of homologous chromosomes, two, three, or four chromatids can take part in crossing-
135
You might be wondering about crossovers between sister chromatids. They do occur but are rare. They do not produce new allele combinations and so are not usually considered.