4.4 Centromere Mapping with Linear Tetrads
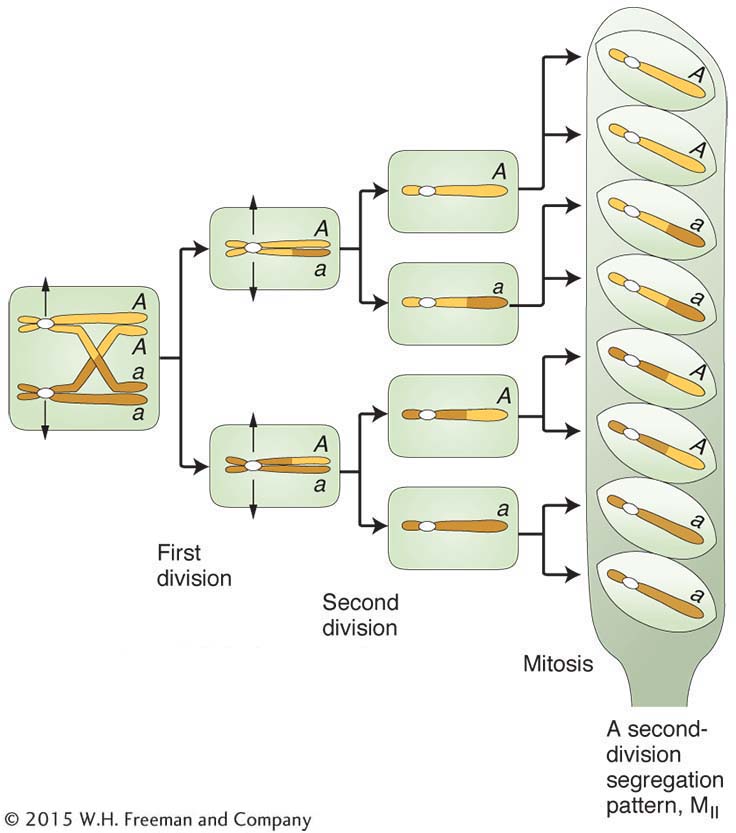
Centromeres are not genes, but they are regions of DNA on which the orderly reproduction of living organisms absolutely depends and are therefore of great interest in genetics. In most eukaryotes, recombination analysis cannot be used to map the loci of centromeres because they show no heterozygosity that can enable them to be used as markers. However, in the fungi that produce linear tetrads (see Chapter 3), centromeres can be mapped. We will use the fungus Neurospora as an example. Recall that, in haploid fungi such as Neurospora, haploid nuclei from each parent fuse to form a transient diploid, which undergoes meiotic divisions along the long axis of the ascus, and so each meiocyte produces a linear array of eight ascospores, called an octad. These eight ascospores constitute the four products of meiosis (a tetrad) plus a postmeiotic mitosis.
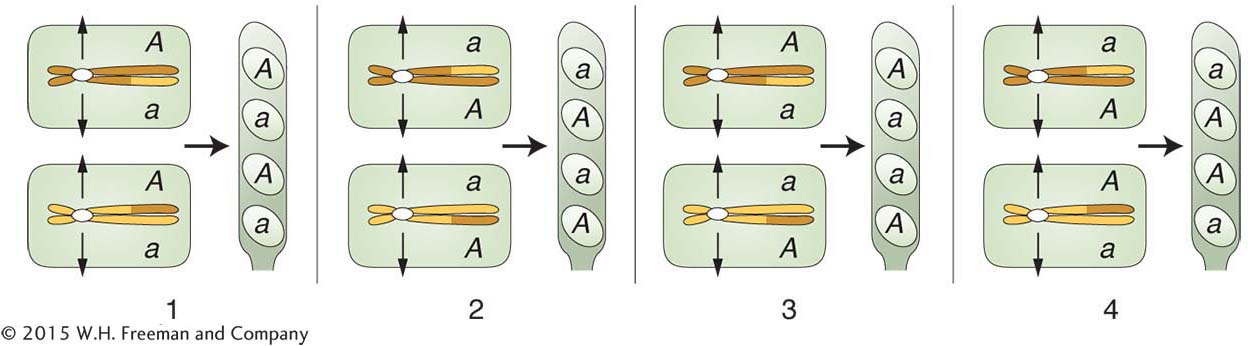
In its simplest form, centromere mapping considers a gene locus and asks how far this locus is from its centromere. The method is based on the fact that a different pattern of alleles will appear in a linear tetrad or octad that arises from a meiosis with a crossover between a gene and its centromere. Consider a cross between two individuals, each having a different allele at a locus (say, A × a). Mendel’s law of equal segregation dictates that, in an octad, there will always be four ascospores of genotype A and four of a, but how will they be arranged? If there has been no crossover in the region between A/a and the centromere, there will be two adjacent blocks of four ascospores in the linear octad (see Figure 3-
149
|
Octads |
|||||
|---|---|---|---|---|---|
|
A |
a |
A |
a |
A |
a |
|
A |
a |
A |
a |
A |
a |
|
A |
a |
a |
A |
a |
A |
|
A |
a |
a |
A |
a |
A |
|
a |
A |
A |
a |
a |
A |
|
a |
A |
A |
a |
a |
A |
|
a |
A |
a |
A |
A |
a |
|
a |
A |
a |
A |
A |
a |
|
126 |
132 |
9 |
11 |
10 |
12 |
|
Total = 300 |
|||||
The first two columns on the left are from meioses with no crossover in the region between the A locus and the centromere. The letter M is used to stand for a type of segregation at meiosis. The patterns for the first two columns are called MI patterns, or first-
You can see that the frequency of octads with an MII pattern should be proportional to the size of the centromere-
150