18.4 Genetic Variation and Its Measurement
To study the amount and distribution of genetic variation in populations, we need some ways to quantify variation. To describe how we can quantify variation, we will use data for the glucose-6-phosphate dehydrogenase (G6PD) gene from humans. G6PD is an X-linked gene that encodes an enzyme that catalyzes a step in glycolysis. The wild-type allele (B) of G6PD has full enzyme activity. A second allele called A− leads to strongly reduced enzyme activity, and individuals who carry this allele develop hemolytic anemia. However, this allele also confers a 50 percent reduction in the risk of severe malaria in carriers. In regions of Africa where malaria is endemic, the A− allele reaches frequencies near 20 percent, although this allele is absent or rare elsewhere. Another allele (A+) leads to only modestly reduced enzyme activity. Unlike individuals carrying the A− allele, individuals carrying only the A+ or B alleles do not develop hemolytic anemia.
Figure 18-14 shows SNPs at 18 polymorphic sites that were identified by sequencing a 5102-bp segment of G6PD from a worldwide sample of 47 men. The remaining 5084 sites were fixed, or invariant: only a single allele (nucleotide) exists in the entire sample for each of these sites. By sampling only males, we observe just one allele and one haplotype for each individual because the gene is X linked. The A+ allele differs from B by a single amino acid change (aspartic acid in place of asparagine) at SNP3 in Figure 18-14. The A− allele differs from the B allele at two amino acids: it contains both the “aspartic acid in place of asparagine” change found in the A+ allele and a second amino acid difference (methionine in place of valine) at SNP2.
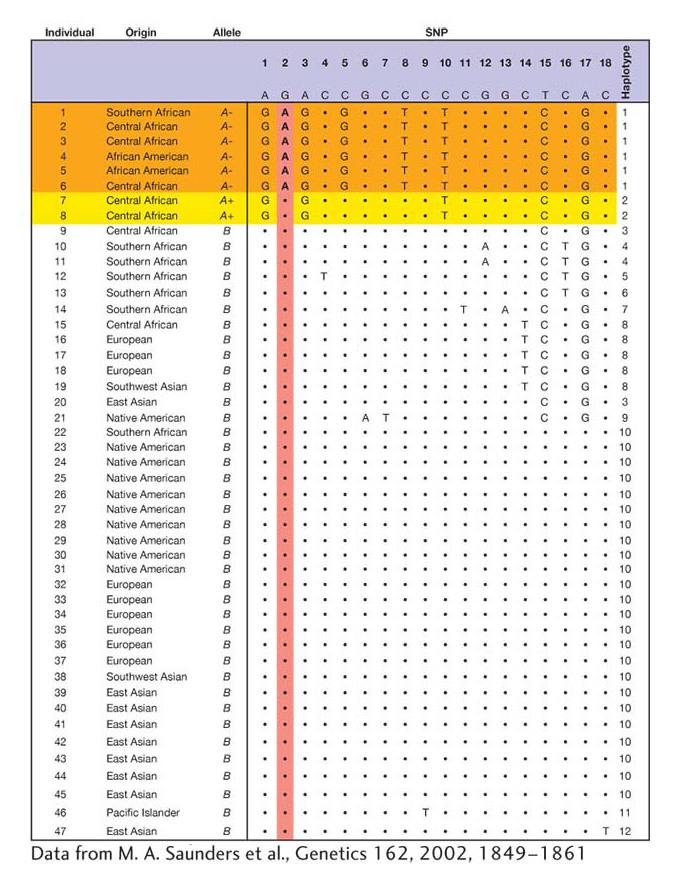
Figure 18-14: Nucleotide variation at the G6PD gene in humans
Figure 18-14: Nucleotide variation for 5102 bp of the G6PD gene for a worldwide sample of 47 men. Only the 18 variable sites are shown. The functional allele class (A−, A+, or β) is shown for each sequence. SNP2 is a nonsynonymous SNP that causes a valine-to-methionine change that underlies differences in enzyme activity associated with the A− allele. SNP3 is a nonsynonymous SNP that causes an aspartic-acid-to-asparagine amino acid change.
[Data from M. A. Saunders et al., Genetics 162, 2002, 1849-1861]
How can we quantify variation at the G6PD locus? One simple measure is the number of polymorphic or segregating sites (S). For the G6PD data, S is 18 for the total sample, 14 for the African sample, and 7 for the non-African sample. Africans contain twice the number of segregating sites despite the fact that our sample has fewer Africans. Another simple measure is the number of haplotypes (NH). The value of NH is 12 for the total sample, 9 for the African sample, and 6 for the non-African sample. Again, the African sample has greater variation. One shortcoming of measures such as S and NH is that the values we observe depend heavily on sample size. If one samples more individuals, then the values of S and NH are apt to increase. For example, our sample has 16 Africans compared to 31 non-Africans. Although S is twice as large in Africans as non-Africans, the difference would likely be even greater if we had an equal number (31) of Africans and non-Africans.
In place of S and NH, we can calculate allele frequencies, which are not biased by differences in sample size. For the G6PD data, B, A−, and A+ have worldwide frequencies of 0.83, 0.13, and 0.04, respectively. However, you’ll note that A− has a frequency of 0.0 outside of Africa and 0.38 in our African sample, which is a substantial difference. We can use allele frequency data to calculate a statistic called gene diversity (GD), which is the probability that two alleles drawn at random from the gene pool will be different. The probability of drawing two different alleles is equal to 1 minus the probability of drawing two copies of the same allele summed over all alleles at the locus. Thus,
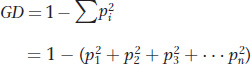
where pi is the frequency of the ith allele and Σ is the summation sign, indicating that we add the squares of all n observed values of p for i = 1, 2, through the nth allele. The value of GD can vary from 0 to 1. It will approach 1 when there is a large number of alleles of roughly equal frequencies. It is 0 when there is a single allele, and it is near 0 whenever there is a single very common allele with a frequency of 0.99 or higher. Table 18-4 shows that gene diversity is quite high in Africans (0.47). Since non-Africans have only the B allele, gene diversity is 0.0.
|
|
|
|
|
|
|
|
|
Number of segregating sites |
|
|
|
|
|
|
|
|
Gene diversity (GD) at SNP2 |
|
|
|
|
|
|
|
|
Table 18-4: Diversity Data for Glucose-6-Phosphate Dehydrogenase (G6PD) in Humans
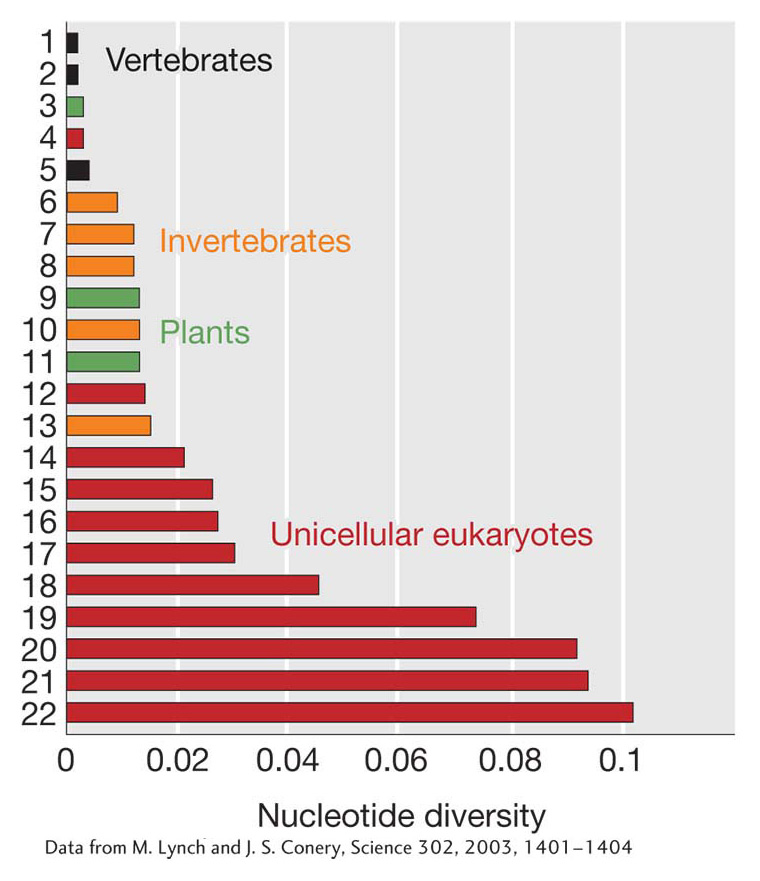
Figure 18-15: Nucleotide diversity among diverse organisms
Figure 18-15: Levels of nucleotide diversity at synonymous and silent sites in some different organisms. (1) Mus musculus, (2) Homo sapiens, (3) Oryza sativa, (4) Plasmodium falciparum, (5) Fugu rubripes, (6) Strongylocentrotus purpuratus, (7) Anopheles gambiae, (8) Ciona intestinalis, (9) Arabidopsis thaliana, (10) Caenorhabditis elegans, (11) Zea mays, (12) Encephalitozoon cuniculi, (13) Drosophila melanogaster, (14) Leishmania major, (15) Trypanosoma species, (16) Toxoplasma gondii, (17) Giardia lamblia, (18) Neurospora crassa, (19) Dictyostelium discoideum, (20) Saccharomyces cerevisiae, (21) Cryptosporidium parvum, (22) Cryptococcus neoformans.
[Data from M. Lynch and J. S. Conery, Science 302, 2003, 1401-1404]
The value of GD is equal to the expected proportion of heterozygotes under Hardy–Weinberg equilibrium, heterozygosity (H). However, H as a concept applies only to diploids, and it would not apply to X-linked loci in males. Thus, conceptually gene diversity (GD) is more appropriate even if it is mathematically the same quantity as H for populations of diploids under Hardy–Weinberg equilibrium.
Gene diversity can be calculated for a single nucleotide site. It can be averaged over all the nucleotide sites in a gene, in which case it is referred to as nucleotide diversity. Since the vast majority of nucleotides in any two copies of a gene from a species are typically the same, values for nucleotide diversity for genes are typically very small. For G6PD, there are only 18 polymorphic nucleotide sites but 5084 invariant sites. The average nucleotide diversity for the entire G6PD gene sequence is 0.0008 in Africans, 0.0002 in non-Africans, and 0.0006 for the entire sample. These values tell us that Africans have four times as much nucleotide diversity at G6PD as non-Africans.
Figure 18-15 shows the level of nucleotide diversity in several organisms. Unicellular eukaryotes are the most diverse, followed by plants and then invertebrates. Vertebrates are the least diverse group; however, most vertebrates still possess a lot of nucleotide diversity. For humans, nucleotide diversity is about 0.001, meaning that two randomly chosen human chromosomes will differ at about 1 bp per thousand. With 3 billion bp in our genome, that adds up to a total of about 3 million differences between the set of chromosomes inherited from a person’s mother and the set inherited from a person’s father for non-inbred individuals.
KEY CONCEPT
Biological populations are often rich in genetic variation. This diversity can be quantified by different statistics to compare levels of variation among populations and species.