19.6 Association Mapping in Random-Mating Populations
If you have read a news report recently announcing that researchers have identified a susceptibility gene for autism, diabetes, hypertension, or some other disorder, there is an excellent chance that the gene was discovered using the technique we are about to review, which is called association mapping. Association mapping is a method for finding QTL in the genome based on naturally occurring linkage disequilibrium (see Chapter 18) between a marker locus and the QTL in a random-mating population. Because it uses linkage disequilibrium, the method is also called linkage-disequilibrium mapping. As we will see, this method often allows researchers to directly identify the specific genes that control the differences in phenotype among members of a population.
The basic idea behind association mapping has been around and used for decades. Here is an example from the 1990s for the ApoE gene in humans, a gene involved in lipoprotein (lipid-protein-complex) metabolism. Because of its role in lipoprotein metabolism, ApoE was considered a candidate gene for a causative role in cardiovascular disease, the accumulation of fatty (lipid) deposits in the arteries. Researchers looked for statistical associations between the alleles of ApoE that people carry and whether they had cardiovascular disease. They found an association between the e4 allele of this gene and the disease—people carrying the e4 allele were 42 percent more likely to have the disease than those who carried other alleles. Although this type of study was successful, it required that a candidate gene suspected to affect the trait be known in advance.
Over the past decade, advances in genomic technologies have catalyzed the broad-scale application of association mapping. In particular, association mapping has been revolutionized by the development of genome-wide SNP maps and high-throughput genotyping technologies that allow scoring of hundreds of thousands of SNPs in tens of thousands of individuals (see Chapter 18). Association mapping is now routinely used to scan the entire genome for genes contributing to quantitative variation. This type of study is known as a genome-wide association study (GWA study or GWAS). A major advantage of GWA studies is that candidate genes are not required since one is scanning every gene in the genome.
Association mapping offers several advantages over QTL mapping. First, since it is performed with random-mating populations, there is no need to make controlled crosses or work with human families with known parent–offspring relationships. Second, it tests many alleles at a locus at once. In QTL-mapping studies, there are two parents (Beefmaster and Sungold tomatoes in the example above) and so only two alleles are being compared. With association mapping, all the alleles in the population are being assayed at the same time. Finally, association mapping can lead to the direct identification of the genes at the QTL without the need for subsequent fine-mapping studies. This is possible because the SNPs in any gene that influences the trait will show stronger associations with the trait than SNPs in other genes. Let’s take a look at how it works.
The basic method
Let’s begin by looking at how genetic variation is patterned across the genome in a population. In Chapter 18, we discussed linkage disequilibrium (LD), or the nonrandom association of alleles at two loci. Figure 19-17 shows how LD could appear among a sample of chromosomes from 18 different individuals. SNPs (or other polymorphisms) that are close to each other tend to be in strong disequilibrium, while those that are farther apart are in weak or no disequilibrium. Genomes also tend to have recombination hotspots, points where crossing over occurs at a high frequency. Hotspots disrupt linkage disequilibrium such that SNPs on either side of the hotspot are in equilibrium with each other. SNPs that are not separated by a hotspot form a haplotype block of strongly correlated SNPs.
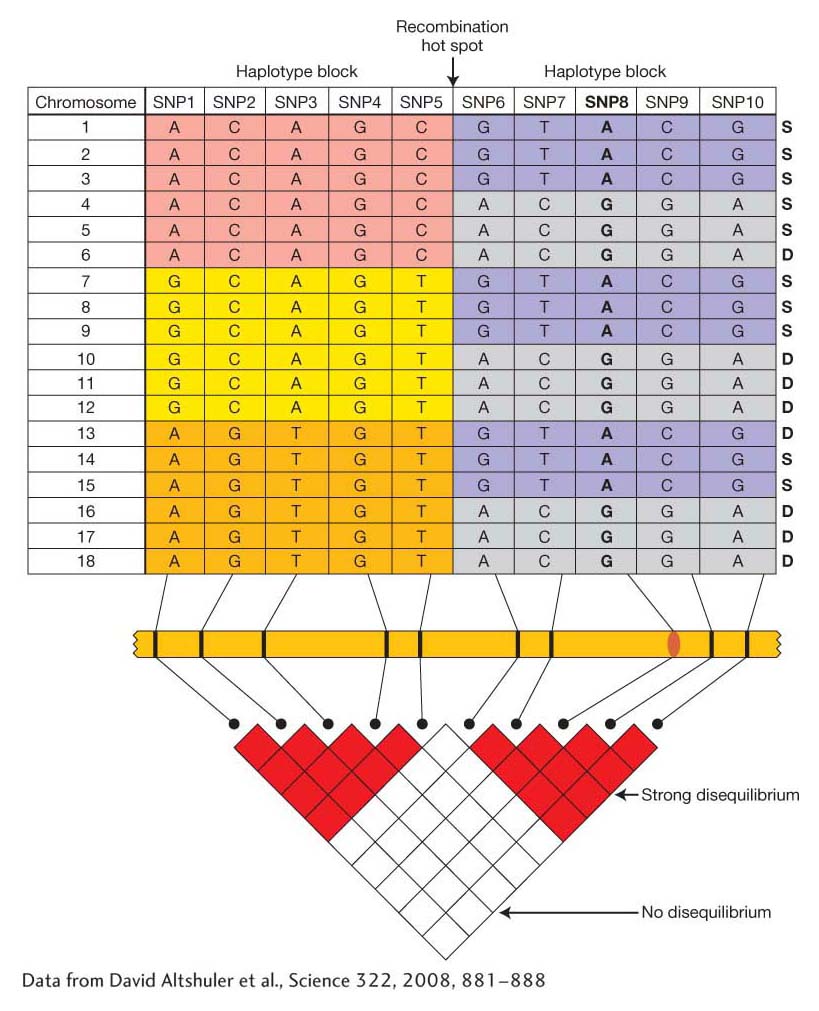
Figure 19-17: Recombination hotspots disrupt linkage disequilibrium
Figure 19-17: (top) Diagram of the distribution of SNPs and haplotypes for a chromosomal segment from 18 individuals. Haplotypes often occur in blocks (regions of lower recombination) separated from one another by recombination hotspots (different colors indicate haplotype blocks). (The column of S’s and D’s at the right are for Problem 19-4.) SNP8 (bold) controls a difference in trait values. (bottom) You can tell whether two SNPs show disequilibrium by noting the color of the square where the rows for the markers intersect. Within a haplotype block, SNPs show strong disequilibrium. SNPs in different haplotype blocks show weak or no disequilibrium.
[Data from David Altsftuler et al., Science 322, 2008, 881–888.]
Suppose SNP8 in Figure 19-17 is a SNP in a gene that causes a difference in phenotype such that individuals with the A/A genotype have a different phenotype than those with either A/G or G/G. SNP8 could affect phenotype by causing an amino acid change or affecting gene expression. SNP8 or any SNPs that directly affect a phenotype are called functional SNPs. Since SNP8 is in strong disequilibrium with other SNPs in the block (SNPs 6, 7, 9, and 10), any of these other SNPs can serve as a proxy for the functional SNP8. Individuals who are T/T at SNP7 will have the same phenotype as those who are A/A at SNP8 because SNP7 and SNP8 are in LD. When the SNP genotypes are correlated (in disequilibrium), then the trait values will be correlated. For this reason, GWA studies do not need to survey the actual functional SNPs, but they do need to have SNPs in every haplotype block.
To conduct a GWA study for a disease condition in humans, we might survey 2000 individuals with a disorder such as adult-onset, or type 2, diabetes. We would also select another 2000 control individuals who do not have this disorder. Each of the 4000 participants would donate blood from which their DNA would be extracted. The DNA samples would be genotyped for a set of 300,000 SNPs that are distributed across the entire genome. We want a sufficient number of SNPs so that each of the haplotype blocks in the genome is marked by one or more SNPs (see Figure 19-17). The resulting data set would be enormous—consisting of 300,000 genotypes in 4000 individuals—a total of 1.2 billion data points. A small part of such a data set is shown in Table 19-8.
Table 19-8: Part of a Simulated Data Set for an Association-Mapping Experiment
Once the data are assembled, the researcher performs a statistical test on each SNP to determine whether one of its alleles is more frequently associated with diabetes than expected by chance. In the case of a categorical trait such as being “affected” or “not affected” by diabetes, statistical tests similar to the χ2 test (see Chapter 3) can be used. A statistical test is performed separately on each SNP and the P values plotted along the chromosome. The null hypothesis is that the SNP is not associated with the trait. If the P value for a SNP falls below 0.05, then the evidence for the null hypothesis is weak and we will favor the alternative hypothesis that the different genotypes at the SNP are associated with different phenotypes for the trait. Association mapping does not actually prove that a gene or a SNP within a gene affects a trait. It only provides statistical evidence for an association between the SNP and the trait. Proof requires molecular characterization of the gene and its different alleles.
Figure 19-18a shows the results of an association-mapping study for body size in dogs. Each dot plotted along the chromosomes (x-axis) represents the P value (y-axis) for a test of association between body size and a SNP. The P values are plotted using an inverse scale such that the higher up the y-axis, the smaller the value. On chromosome 15, there is a cluster of SNPs above the threshold line, indicating that the null hypothesis of no association can be rejected for these SNPs in favor of the alternative hypothesis that a gene affecting body size in dogs is located at this position. The strong peak on chromosome 15 involves SNPs in the insulin-like growth factor-1 (IGF1) gene, a gene that encodes a hormone involved in juvenile growth in mammals. This gene is the major contributor to the difference in size between small and large breeds of dogs (Figure 19-18b).
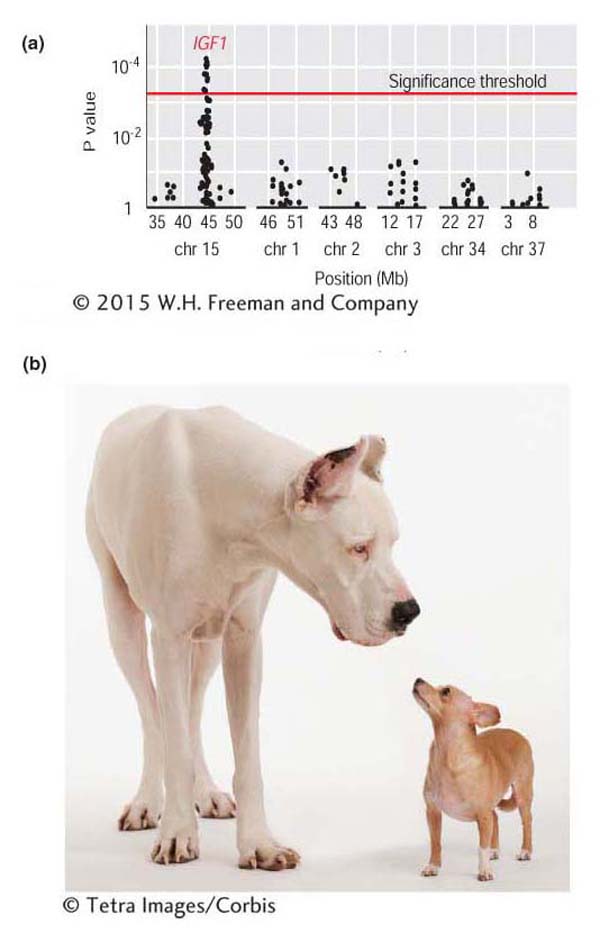
Figure 19-18: Association mapping finds a gene for body size in dogs
Figure 19-18: (a) Results from an association-mapping experiment for body size in dogs. Each dot in the plot represents the P value for a test of association between a SNP and body size. Dots above the “threshold line” show evidence for a statistically significant association. (b) Examples of a small and large breed of dog.
[(b) (c) © Tetra Images/Corbis]
GWA, genes, disease, and heritability
Over the past 10 years, a large number of GWA studies has been performed, and much has been learned from them about heritable variation in humans and other species. Let’s look at one of the largest studies, which was a search for disease-risk genes in a group of 17,000 people using 500,000 SNPs. Figure 19-19 shows plots of the P values for associations between SNPs and several common diseases. Green dots are the statistically significant associations. Notice the spike of green dots on chromosome 6 for rheumatoid arthritis and type 1 (juvenile) diabetes. These are two autoimmune diseases, and this spike is positioned over a human leukocyte antigen (HLA) gene of the major histocompatibility complex (MHC) of genes that regulates immune response in humans and other vertebrates. Thus, genes active in the normal immune response are implicated as a cause of autoimmune diseases. The gene PTPN22 is also associated with risk for type 1 diabetes. PTPN22 encodes the protein tyrosine phosphatase, which is expressed in lymphoid cells of the immune system. For coronary artery disease, there is a significant association with the ApoE gene, confirming an earlier study mentioned above.
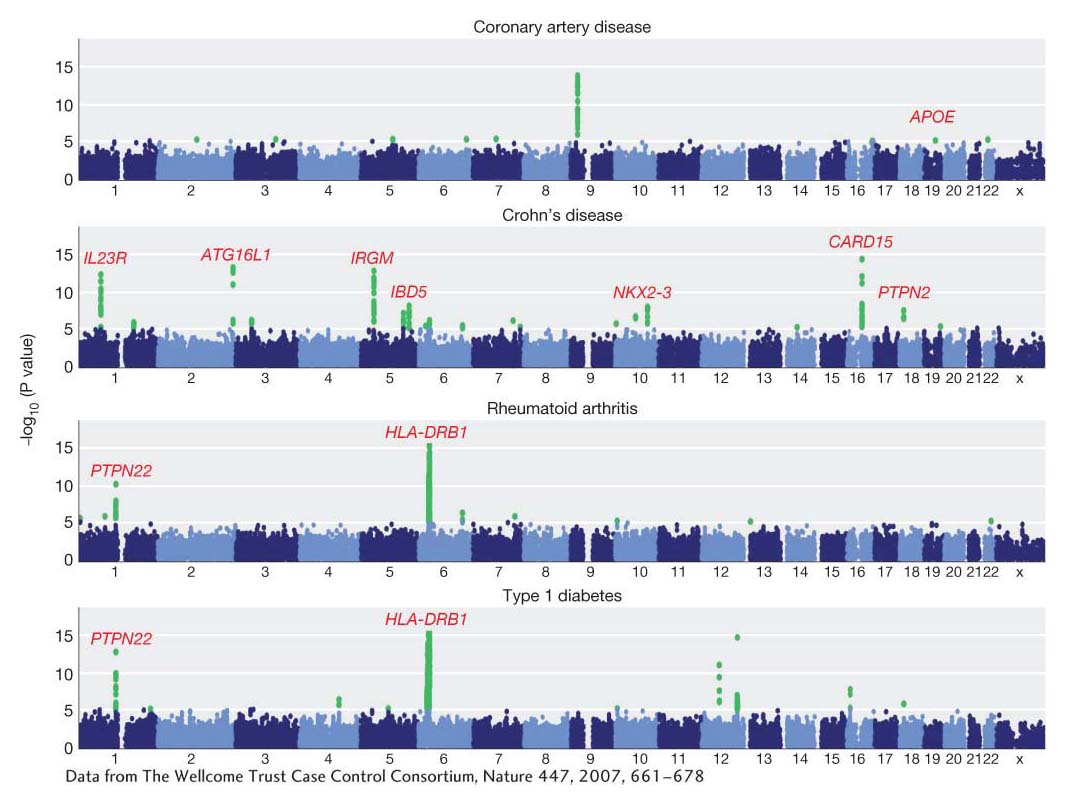
Figure 19-19: Association mapping identifies genes for disease susceptibility
Figure 19-19: Results from a genome-wide association study of common diseases in humans. The 23 human chromosomes are arrayed from left to right. The y-axis shows the P value for the statistical test of an association between the disease and each SNP. Significant test results are shown as green dots. The names of some genes identified by this analysis are shown in red.
[Data from The Wellcome Trust Case Control Consortium, Nature 447, 2007, 661–678.]
GWA studies have identified over 300 risk genes for some 70 diseases, and the numbers are growing. These data are ushering in a new era of personal genomics, in which an individual can have his or her genome scanned to determine their genotype at genes known to increase disease risk. Although this science is relatively young, it is possible to identify individuals who have a 10-fold higher risk for certain diseases than other members of the population. Such information can be used to initiate preventative measures and changes in lifestyle (environment) that contribute to disease risk. Some companies are proposing to offer for purchase at your local drugstore “genetic test kits” for specific diseases such as Alzheimer’s disease. Bioethicists have expressed concern that consumers are not prepared to evaluate the results appropriately without the counsel of medical professionals.
Since height in humans is a classic quantitative trait, quantitative geneticists had great interest in performing GWA studies for this trait. GWA studies have identified over 180 genes affecting height. Each of these genes has a small additive effect (∼1 to 4 mm), as expected for a trait governed by many genes. However, a perplexing result was that the 180 genes accounted for only 10 percent of the genetic variance in height. This falls far short of the roughly 80 percent value for broad-sense heritability for height. The difference between 10 percent and 80 percent has been dubbed the missing heritability. For disease risk, there is also much missing heritability. For example, GWA studies have succeeded in explaining only 10 percent of the genetic variation for Crohn’s disease and only 5 percent of the genetic variation for type 2 diabetes.
It has come as a surprise to many geneticists that GWA studies with hundreds of thousands of SNPs blanketing the genome and samples of over 10,000 individuals should be able to account for only a tiny fraction of the heritable variation. Currently, it is unknown why this is the case. Researchers had expected that common diseases such as type 2 diabetes would be caused by common alleles; that is, alleles with frequencies between 5 and 95 percent. GWA studies are designed to detect the effects of common alleles, but they are not designed to detect the effects of rare alleles. Thus, one hypothesis is that susceptibility for many common diseases (or height variation) is caused by a large number of rare alleles. In other words, the disease-susceptibility alleles that segregate in one family are different from those in another, unrelated family.
Despite the inability of GWA studies to explain all the heritable variation for traits, this approach has provided a major advance in understanding quantitative genetic variation. Hundreds of new genes contributing to quantitative variation for disease risk have been identified. These genes are now the targets for the development of new therapies. Beyond humans, GWA studies have advanced our understanding of the inheritance of quantitative traits in Arabidopsis, Drosophila, yeast, and maize.
KEY CONCEPT
Association mapping is a method for identifying statistical associations between molecular markers and phenotypic variation for complex traits. Linkage disequilibrium in a population between the marker locus and a functional variant in a gene can cause the association. If molecular markers over the entire genome are available, then a genome-wide association (GWA) study can be accomplished. GWA studies in humans have enabled geneticists to identify hundreds of genes that contribute to the risks of developing many common diseases.