FIGURE 10.3
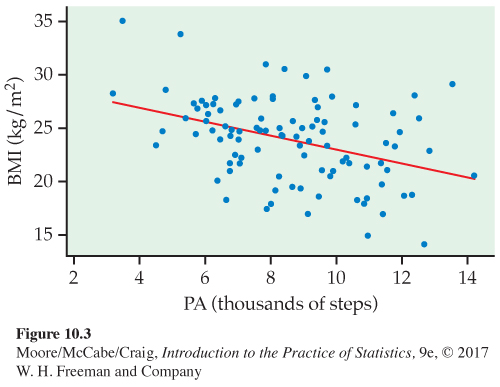
Scatterplot of body mass index (BMI) versus physical activity (PA) with the leas
t-
squares line,
Example 10.2
.