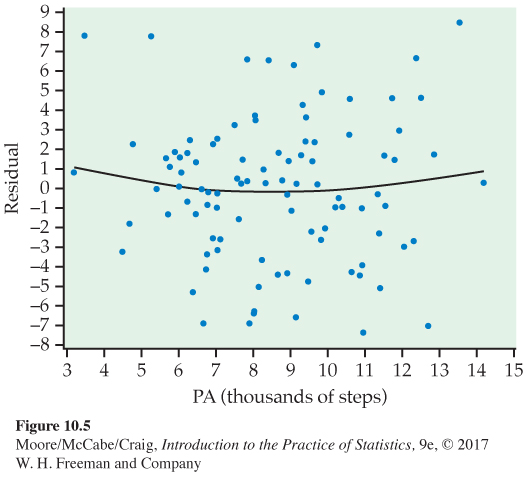
FIGURE 10.5
Plot of residuals versus physical activity (PA) with a smooth function for the physical activity example.