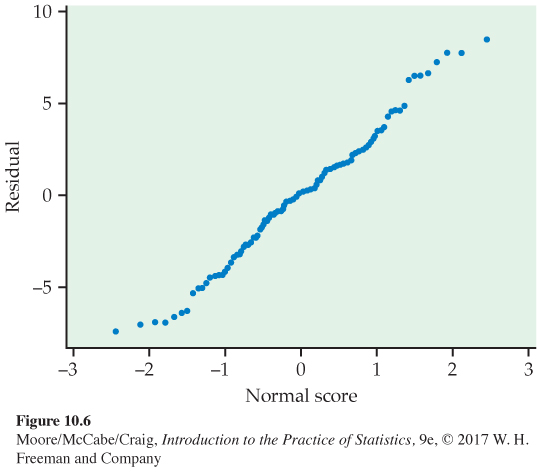
FIGURE 10.6
Normal quantile plot of the residuals for the physical activity example.