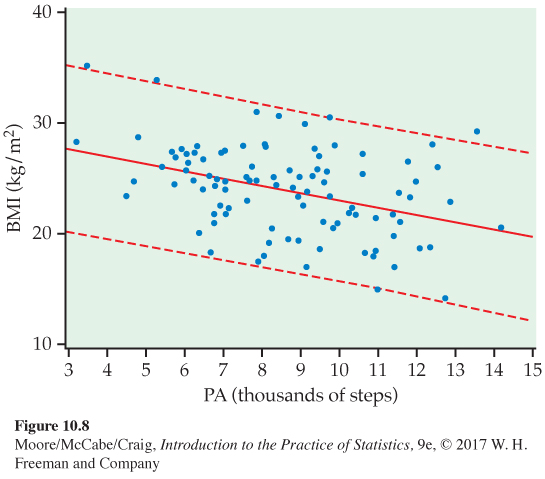
FIGURE 10.8
The 95% prediction limits (dashed curves) for individual responses for the physical activity example. Compare with
Figure 10.7
. The limits are wider because the margins of error incorporate the variability about the subpopulation means.