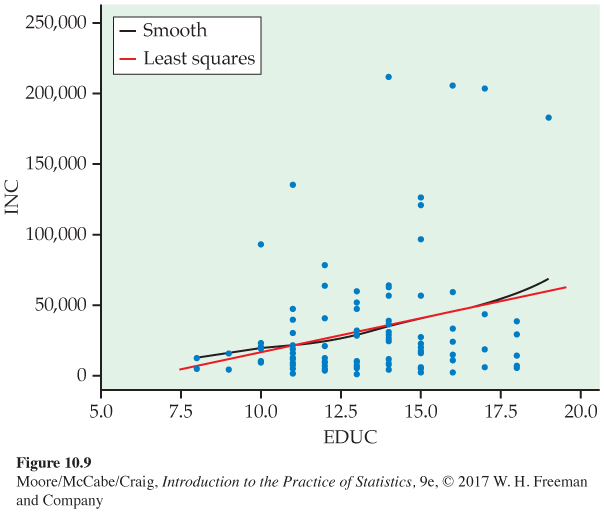
FIGURE 10.9
Scatterplot of income versus education with a smooth function and the leas
t-
squares line,
Example 10.12
. Instead of incomes being Normally distributed, the observations are skewed to the right.