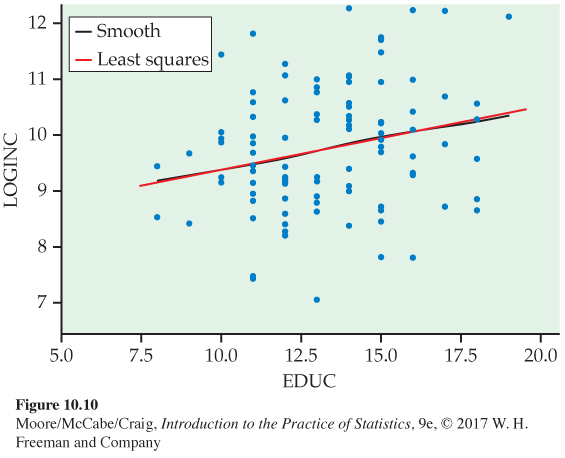
FIGURE 10.10
Scatterplot of income versus education with the new least squares line and smoothed curve,
Example 10.13
. The smoothed curve is now practically the same as the leas
t-
squares line.