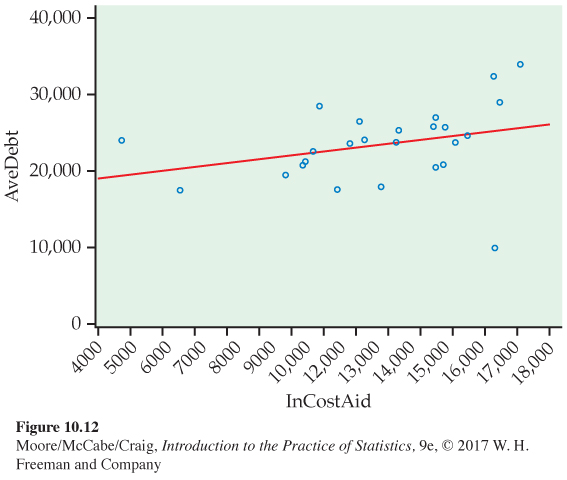
FIGURE 10.12
Scatterplot with leas
t-
squares regression line for a sample of 25 colleges from Kiplinger’s 2015 report,
Exercise 10.12
.