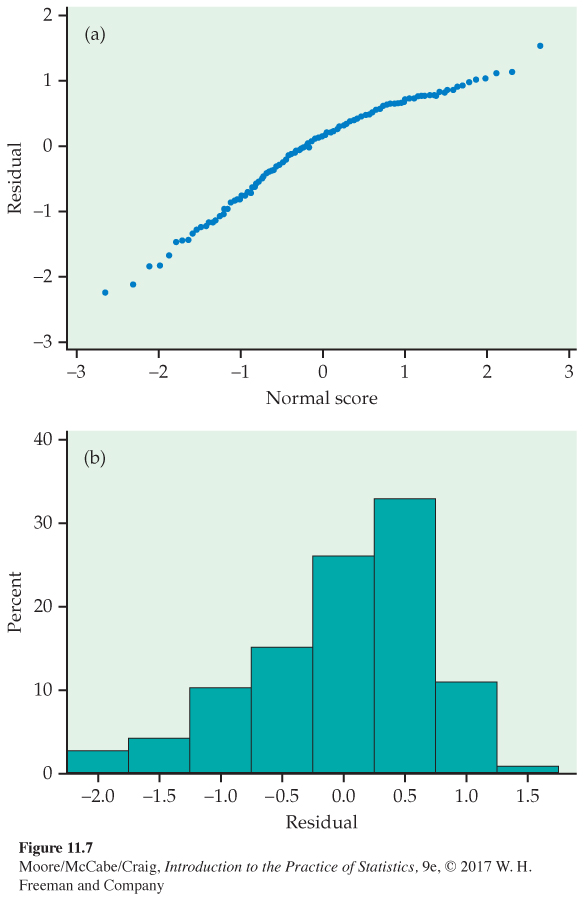
FIGURE 11.7
(a) Normal quantile plot and (b) histogram of the residuals from the high school grades model. There are no important deviations from Normality.