SECTION 4.3 EXERCISES
244
For Exercise 4.42, see page 237; for Exercise 4.43, see page 239; and for Exercise 4.44, see page 241.
Question 4.45
4.45 How many courses? At a small liberal arts college, students can register for one to six courses. Let X be the number of courses taken in the fall by a randomly selected student from this college. In a typical fall semester, 5% take one course, 5% take two courses, 13% take three courses, 26% take four courses, 36% take five courses, and 15% take six courses. Let X be the number of courses taken in the fall by a randomly selected student from this college. Describe the probability distribution of this random variable.
Question 4.46
4.46 Make a graphical display. Refer to the previous exercise. Use a probability histogram to provide a graphical description of the distribution of X.
Question 4.47
4.47 Find some probabilities. Refer to Exercise 4.45.
(a) Find the probability that a randomly selected student takes three or fewer courses.
(b) Find the probability that a randomly selected student takes four or five courses.
(c) Find the probability that a randomly selected student takes eight courses.
Question 4.48
4.48 Use the uniform distribution. Suppose that a random variable X follows the uniform distribution described in Example 4.25 (page 240). For each of the following events, find the probability and illustrate your calculations with a sketch of the density curve similar to the ones in Figure 4.9 (page 240).
(a) The probability that X is less than 0.2.
(b) The probability that X is greater than or equal to 0.7.
(c) The probability that X is less than 0.8 and greater than 0.4.
(d) The probability that X is 0.7.
Question 4.49
4.49 What’s wrong? In each of the following scenarios, there is something wrong. Describe what is wrong and give a reason for your answer.
(a) The possible values for a discrete random variable can’t be negative.
(b) A continuous random variable can take any value between 0 and 1.
(c) Normal distributions are discrete random variables.
Question 4.50
4.50 Use of Twitter. Suppose that the population proportion of Internet users who say that they use Twitter or another service to post updates about themselves or to see updates about others is 19%.12 Think about selecting random samples from a population in which 19% are Twitter users.
(a) Describe the sample space for selecting a single person.
(b) If you select three people, describe the sample space.
(c) Using the results of part (b), define the sample space for the random variable that expresses the number of Twitter users in the sample of size 3.
(d) What information is contained in the sample space for part (b) that is not contained in the sample space for part (c)? Do you think this information is important? Explain your answer.
Question 4.51
4.51 Use of Twitter. Refer to the previous exercise. Find the probabilities for the number of Twitter users in a sample of size 2.
Question 4.52
4.52 Households and families in government data. In government data, a household consists of all occupants of a dwelling unit, while a family consists of two or more persons who live together and are related by blood or marriage. So all families form households, but some households are not families. Here are the distributions of household size and of family size in the United States:
| Number of persons | 1 | 2 | 3 | 4 | 5 | 6 | 7 |
| Household probability | 0.27 | 0.33 | 0.16 | 0.14 | 0.06 | 0.03 | 0.01 |
| Family probability | 0 | 0.44 | 0.22 | 0.20 | 0.09 | 0.03 | 0.02 |
Make probability histograms for these two discrete distributions, using the same scales. What are the most important differences between the sizes of households and families?
Question 4.53
4.53 Discrete or continuous. In each of the following situations, decide whether the random variable is discrete or continuous and give a reason for your answer.
(a) Your web page has five different links, and a user can click on one of the links or can leave the page. You record the length of time that a user spends on the web page before clicking one of the links or leaving the page.
(b) You record the number of hits per day on your web page.
(c) You record the yearly income of a visitor to your web page.
Question 4.54
4.54 Texas hold ’em. The game of Texas hold ’em starts with each player receiving two cards. Here is the probability distribution for the number of aces in two-card hands:
| Number of aces | 0 | 1 | 2 |
| Probability | 0.8507 | 0.1448 | 0.0045 |
245
(a) Verify that this assignment of probabilities satisfies the requirement that the sum of the probabilities for a discrete distribution must be 1.
(b) Make a probability histogram for this distribution.
(c) What is the probability that a hand contains at least one ace? Show two different ways to calculate this probability.
Question 4.55
4.55 Tossing two dice. Some games of chance rely on tossing two dice. Each die has six faces, marked with one, two, . . . , six spots called pips. The dice used in casinos are carefully balanced so that each face is equally likely to come up. When two dice are tossed, each of the 36 possible pairs of faces is equally likely to come up. The outcome of interest to a gambler is the sum of the pips on the two up-faces. Call this random variable X.
(a) Write down all 36 possible pairs of up-faces.
(b) If all pairs have the same probability, what must be the probability of each pair?
(c) Write the value of X next to each pair of up-faces and use this information with the result of part (b) to give the probability distribution of X. Draw a probability histogram to display the distribution.
(d) One bet available in the game called craps wins if a 7 or an 11 comes up on the next roll of two dice. What is the probability of rolling a 7 or an 11 on the next roll?
(e) Several bets in craps lose if a 7 is rolled. If any outcome other than 7 occurs, these bets either win or continue to the next roll. What is the probability that anything other than a 7 is rolled?
Question 4.56
![]() 4.56 Nonstandard dice. Nonstandard dice can produce interesting distributions of outcomes. You have two balanced, six-sided dice. One is a standard die, with faces having one, two, three, four, five, and six spots. The other die has three faces with one spot and three faces with six spots. Find the probability distribution for the total number of spots Y on the up-faces when you roll these two dice.
4.56 Nonstandard dice. Nonstandard dice can produce interesting distributions of outcomes. You have two balanced, six-sided dice. One is a standard die, with faces having one, two, three, four, five, and six spots. The other die has three faces with one spot and three faces with six spots. Find the probability distribution for the total number of spots Y on the up-faces when you roll these two dice.
Question 4.57
4.57 Spell-checking software. Spell-checking software catches “nonword errors,” which are strings of letters that are not words, as when “the” is typed as “eth.” When undergraduates are asked to write a 250-word essay (without spell-checking), the number X of nonword errors has the following distribution:
| Value of X | 0 | 1 | 2 | 3 | 4 |
| Probability | 0.1 | 0.3 | 0.3 | 0.2 | 0.1 |
(a) Sketch the probability distribution for this random variable.
(b) Write the event “at least one nonword error” in terms of X. What is the probability of this event?
(c) Describe the event X ≤ 3 in words. What is its probability? What is the probability that X < 3?
Question 4.58
4.58 Find the probabilities. Let the random variable X be a random number with the uniform density curve in Figure 4.9 (page 240). Find the following probabilities:
(a) P(X ≥ 0.35).
(b) P(X = 0.35).
(c) P(0.35 < X < 1.35).
(d) P(0.18 ≤ X ≤ 0.25 or 0.4 ≤ X ≤ 0.5).
(e) X is not in the interval 0.4 to 0.8.
Question 4.59
4.59 Uniform numbers between 0 and 2. Many random number generators allow users to specify the range of the random numbers to be produced. Suppose that you specify that the range is to be all numbers between 0 and 2. Call the random number generated Y. Then the density curve of the random variable Y has constant height between 0 and 2, and height 0 elsewhere.
(a) What is the height of the density curve between 0 and 2? Draw a graph of the density curve.
(b) Use your graph from part (a) and the fact that probability is area under the curve to find P(Y ≤ 1.6).
(c) Find P(0.5 < Y < 1.7).
(d) Find P(Y ≥ 0.95).
Question 4.60
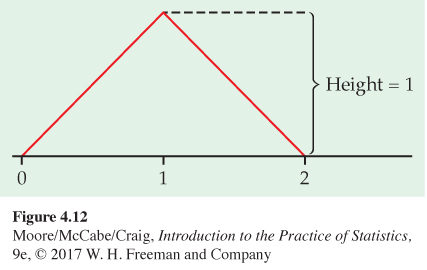
![]() 4.60 The sum of two uniform random numbers. Generate two random numbers between 0 and 1 and take Y to be their sum. Then Y is a continuous random variable that can take any value between 0 and 2. The density curve of Y is the triangle shown in Figure 4.12.
4.60 The sum of two uniform random numbers. Generate two random numbers between 0 and 1 and take Y to be their sum. Then Y is a continuous random variable that can take any value between 0 and 2. The density curve of Y is the triangle shown in Figure 4.12.
(a) Verify by geometry that the area under this curve is 1.
(b) What is the probability that Y is less than 1? [Sketch the density curve, shade the area that represents the probability, then find that area. Do this for part (c) also.]
(c) What is the probability that Y is greater than 1.5?
(d) What is the probability that Y is greater than 0.5?
246
Question 4.61
4.61 How many close friends? How many close friends do you have? Suppose that the number of close friends adults claim to have varies from person to person with mean μ = 9 and standard deviation σ = 2.4. An opinion poll asks this question of an SRS of 1100 adults. We will see in the next chapter that, in this situation, the sample mean response has approximately the Normal distribution with mean 9 and standard deviation 0.0724. What is , the probability that estimates μ to within ±1?
Question 4.62
4.62 Normal approximation for a sample proportion. A sample survey contacted an SRS of 700 registered voters in Oregon shortly after an election and asked respondents whether they had voted. Voter records show that 56% of registered voters had actually voted. We will see in the next chapter that, in this situation, the proportion of the sample who voted has approximately the Normal distribution with mean μ = 0.56 and standard deviation σ = 0.019.
(a) If the respondents answer truthfully, what is ? This is the probability that estimates 0.56 within plus or minus 0.04.
(b) In fact, 72% of the respondents said they had voted (). If respondents answer truthfully, what is ? This probability is so small that it is good evidence that some people who did not vote claimed that they did vote.