6.3 6.3 Use and Abuse of Tests
384
When you complete this section, you will be able to:
• Explain why it is important to report the P-value and not just report whether the result is statistically significant or not.
• Discriminate between practical (or scientific) significance and statistical significance.
• Identify poorly designed studies where formal statistical inference is suspect.
• Understand the consequences of searching solely for statistical significance, whether through the investigation of multiple tests or by identifying and testing using the same data set.
Carrying out a test of significance is often quite simple, especially if the P-value is given effortlessly by a computer. Using tests wisely is not so simple. Each test is valid only in certain circumstances, with properly produced data being particularly important.
The z test, for example, should bear the same warning label that was attached in Section 6.1 to the corresponding confidence interval (page 355). Similar warnings accompany the other tests that we will learn. There are additional caveats that concern tests more than confidence intervals, enough to warrant this separate section. Some hesitation about the unthinking use of significance tests is a sign of statistical maturity.
The reasoning of significance tests has appealed to researchers in many fields, so that tests are widely used to report research results. In this setting Ha is a “research hypothesis” asserting that some effect or difference is present. The null hypothesis H0 says that there is no effect or no difference. A low P-value represents good evidence that the research hypothesis is true. Here are some comments on the use of significance tests, with emphasis on their use in reporting scientific research.
Choosing a level of significance
![]()
The intention of a test of significance is to give a clear statement of the degree of evidence provided by the sample against the null hypothesis. The P-value does this. It is common practice to report P-values and to describe results as statistically significant whenever P ≤ 0.05. However, there is no sharp border between “significant” and “not significant,” only increasingly strong evidence as the P-value decreases. Having the P-value with a description of the effect that we have found allows us to draw better conclusions from our data.
EXAMPLE 6.21
Information provided by the P-value. Suppose that the test statistic for a two-sided significance test for a population mean is z = 1.95. From Table A we can calculate the P-value. It is
P = 2[1 − P(Z ≤ 1.95)] = 2(1 − 0.9744) = 0.0512
We have failed to meet the standard of evidence for α = 0.05. However, with the information provided by the P-value, we can see that the result just barely missed the standard. If the effect in question is interesting and potentially important, we might want to design another study with a larger sample to investigate it further.
385
Here is another example where the P-value provides useful information beyond that provided by the statement that we reject or fail to reject the null hypothesis.
EXAMPLE 6.22
More on information provided by the P-value. We have a test statistic of z = −4.66 for a two-sided significance test on a population mean. Software tells us that the P-value is 0.000003. This means that there are 3 chances in 1,000,000 of observing a sample mean this far or farther away from the null hypothesized value of μ. This kind of event is virtually impossible if the null hypothesis is true. There is no ambiguity in the result; we can clearly reject the null hypothesis.
We frequently report small P-values such as that in the previous example as P < 0.001. This corresponds to a chance of 1 in 1000 and is sufficiently small to lead us to a clear rejection of the null hypothesis.
One reason for the common use of α = 0.05 is the great influence of Sir R. A. Fisher, the inventor of formal statistical methods for analyzing experimental data. Here is his opinion on choosing a level of significance: “A scientific fact should be regarded as experimentally established only if a properly designed experiment rarely fails to give this level of significance.”24
What statistical significance does not mean
![]()
When a null hypothesis (“no effect” or “no difference”) can be rejected at the usual level α = 0.05, there is good evidence that an effect is present. That effect, however, can be extremely small. When large samples are available, even tiny deviations from the null hypothesis will be statistically significant.
EXAMPLE 6.23
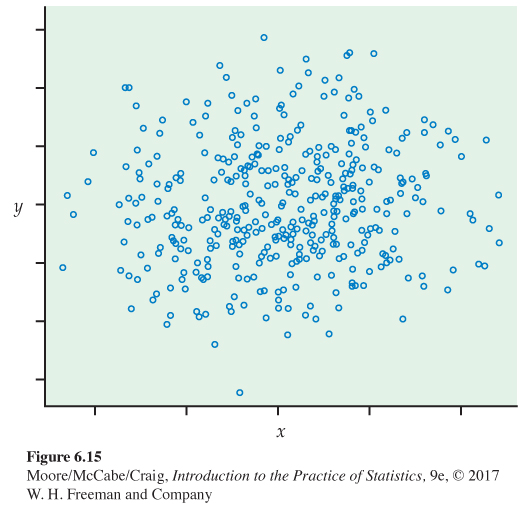
It’s significant but is it important? Suppose that we are testing the null hypothesis of no correlation between two variables. With 400 observations, an observed correlation of only r = 0.1 is significant evidence at the α = 0.05 level that the correlation in the population is not zero. Figure 6.15 is an example of 400 (x, y) pairs that have an observed correlation of 0.10. The low significance level does not mean that there is a strong association, only that there is strong evidence of some association. The proportion of the variability in one of the variables explained by the other is r2 = 0.01, or 1%.
386
![]()
For practical purposes, we might well decide to ignore this association. Statistical significance is not the same as practical significance. Statistical significance rarely tells us about the importance of the experimental results. This depends on the context of the experiment.
![]()
The remedy for attaching too much importance to statistical significance is to pay attention to the actual experimental results as well as to the P-value. Plot your data and examine them carefully. Beware of outliers. The user of statistics who feeds the data to a computer without exploratory analysis will often be embarrassed. It is usually wise to give a confidence interval for the parameter in which you are interested. Confidence intervals are not used as often as they should be, while tests of significance are overused.
USE YOUR KNOWLEDGE
Question 6.90
6.90 Is it significant? More than 200,000 people worldwide take the GMAT examination each year when they apply for MBA programs. Their scores vary Normally with mean μ = 540 and standard deviation σ = 100. One hundred students go through a rigorous training program designed to raise their GMAT scores. Test the following hypotheses about the training program
H0: μ = 540
Ha: μ > 540
in each of the following situations.
(a) The students’ average score is . Is this result significant at the 5% level?
(b) Now suppose that the average score is . Is this result significant at the 5% level?
(c) Explain how you would reconcile this difference in significance, especially if any increase greater than 15 points is considered a success.
Don’t ignore lack of significance
There is a tendency to conclude that there is no effect whenever a P-value fails to attain the usual 5% standard. A provocative editorial in the British Medical Journal entitled “Absence of Evidence Is Not Evidence of Absence” deals with this issue.25 Here is one of the examples they cite.
EXAMPLE 6.24
Interventions to reduce HIV-1 transmission. A randomized trial of interventions for reducing transmission of HIV-1 reported an incident rate ratio of 1.00, meaning that the intervention group and the control group both had the same rate of HIV-1 infection. The 95% confidence interval was reported as 0.63 to 1.58.26 The editorial notes that a summary of these results that says the intervention has no effect on HIV-1 infection is misleading. The confidence interval indicates that the intervention may be capable of achieving a 37% decrease in infection; it might also be harmful and produce a 58% increase in infection. Clearly, more data are needed to distinguish between these possibilities.
387
The situation can be worse. Research in some fields has rarely been published unless significance at the 0.05 level is attained.
EXAMPLE 6.25
Journal survey of reported significance results. A survey of four journals published by the American Psychological Association showed that of 294 articles using statistical tests, only eight reported results that did not attain the 5% significance level.27 It is very unlikely that these were the only eight studies of scientific merit that did not attain significance at the 0.05 level. Manuscripts describing other studies were likely rejected because of a lack of statistical significance or never submitted in the first place due to the expectation of rejection.
In some areas of research, small effects that are detectable only with large sample sizes can be of great practical significance. Data accumulated from a large number of patients taking a new drug may be needed before we can conclude that there are life-threatening consequences for a small number of people.
On the other hand, sometimes a meaningful result is not found significant.
EXAMPLE 6.26
A meaningful but statistically insignificant result. A sample of size 10 gave a correlation of r = 0.5 between two variables. The P-value is 0.102 for a two-sided significance test. In many situations, a correlation this large would be interesting and worthy of additional study. When it takes a lot of effort (say, in terms of time or money) to obtain samples, researchers often use small studies like these as pilot projects to gain interest from various funding sources. With financial support, a larger, more powerful study can then be run.
![]()
Another important aspect of planning a study is to verify that the test you plan to use does have high probability of detecting an effect of the size you hope to find. This probability is the power of the test. Power calculations are discussed in Section 6.4.
Statistical inference is not valid for all sets of data
![]()
In Chapter 3, we learned that badly designed surveys or experiments often produce invalid results. Formal statistical inference cannot correct basic flaws in the design.
design of experiments, p. 171
388
EXAMPLE 6.27
confounding, p. 150
English vocabulary and studying a foreign language. There is no doubt that there is a significant difference in English vocabulary scores between high school seniors who have studied a foreign language and those who have not. But because the effect of actually studying a language is confounded with the differences between students who choose language study and those who do not, this statistical significance is hard to interpret. The most plausible explanation is that students who were already good at English chose to study another language. A randomized comparative experiment would isolate the actual effect of language study and so make significance meaningful. Do you think it would be ethical to do such a study?
![]()
Tests of significance and confidence intervals are based on the laws of probability. Randomization in sampling or experimentation ensures that these laws apply. But we must often analyze data that do not arise from randomized samples or experiments. To apply statistical inference to such data, we must have confidence in a probability model for the data. The diameters of successive holes bored in auto engine blocks during production, for example, may behave like independent observations from a Normal distribution. We can check this probability model by examining the data. If the Normal distribution model appears approximately correct, we can apply the methods of this chapter to do inference about the process mean diameter μ.
USE YOUR KNOWLEDGE
Question 6.91
6.91 Home security systems. A recent TV advertisement for home security systems said that homes without an alarm system are three times more likely to be broken into. Suppose that this conclusion was obtained by examining an SRS of police records of break-ins and determining whether the percent of homes with alarm systems was significantly smaller than 50%. Explain why the significance of this study is suspect and propose an alternative study that would help clarify the importance of an alarm system.
Beware of searching for significance
![]()
Statistical significance is an outcome much desired by researchers. It means (or ought to mean) that you have found an effect that you were looking for. The reasoning behind statistical significance works well if you decide what effect you are seeking, design an experiment or sample to search for it, and use a test of significance to weigh the evidence you get. But because a successful search for a new scientific phenomenon often ends with statistical significance, it is all too tempting to make significance itself the object of the search. There are several ways to do this, none of them acceptable in polite scientific society.
EXAMPLE 6.28
Genomics studies. In genomics experiments, it is common to assess the differences in expression for tens of thousands of genes. If each of these genes was examined separately and statistical significance declared for all that had P-values that pass the 0.05 standard, we would have quite a mess. In the absence of any real biological effects, we would expect that, by chance alone, approximately 5% of these tests will show statistical significance. Much research in genomics is directed toward appropriate ways to deal with this situation.28
389
![]()
We do not mean that searching data for suggestive patterns is not proper scientific work. It certainly is. Many important discoveries have been made by accident rather than by design. Exploratory analysis of data is an essential part of statistics. We do mean that the usual reasoning of statistical inference does not apply when the search for a pattern is successful. You cannot legitimately test a hypothesis on the same data that first suggested that hypothesis. The remedy is clear. Once you have a hypothesis, design a study to search specifically for the effect you now think is there. If the result of this study is statistically significant, you have real evidence.