SECTION 9.1 EXERCISES
544
For Exercises 9.1, 9.2, and 9.3, see pages 531–
Question 9.15
9.15 Adult gamers versus teen gamers. In Exercise 8.67 (page 521), you analyzed data from a study that compared adult gamers with teen gamers with respect to the devices on which they play. The study surveyed 1063 adult gamers and 1064 teen gamers. For the adults, 54% played on game consoles (Xbox, PlayStation Wii, etc.), while 89% of the teen gamers played on game consoles. Your analysis in Exercise 8.67 focused on the comparison of two proportions. Use these data to construct a two-
Question 9.16
9.16 Physical education requirements. In Exercise 8.63 (page 520), you analyzed data from a study that included 354 higher education institutions: 225 private and 129 public. Among the private institutions, 60 required a physical education course, while among the public institutions, 101 required a course. Your analysis in that exercise focused on the comparison of two proportions. Use these data to construct a two-
Question 9.17
9.17 Adult gamers versus teen gamers. Refer to Exercise 9.15. Find the joint distribution, the marginal distributions, and the conditional distributions. Which conditional distribution do you prefer to explain the results of your analysis? Give a reason for your answer.
Question 9.18
9.18 Physical education requirements. Refer to Exercise 9.16. Find the joint distribution, the marginal distributions, and the conditional distributions. Which conditional distribution do you prefer to explain the results of your analysis? Give a reason for your answer.
Question 9.19
9.19 Adult gamers versus teen gamers. Refer to Exercise 9.15. Find the expected counts.
Question 9.20
9.20 Physical education requirements. Refer to Exercise 9.16. Find the expected counts.
Question 9.21
9.21 Adult gamers versus teen gamers. Refer to Exercise 9.15. Find the chi-
Question 9.22
9.22 Physical education requirements. Refer to Exercise 9.16. Find the chi-
Question 9.23
9.23 Adult gamers versus teen gamers. Refer to Exercise 9.15. Show that the chi-
Question 9.24
9.24 Physical education requirements. Refer to Exercise 9.16. Show that the chi-
Question 9.25
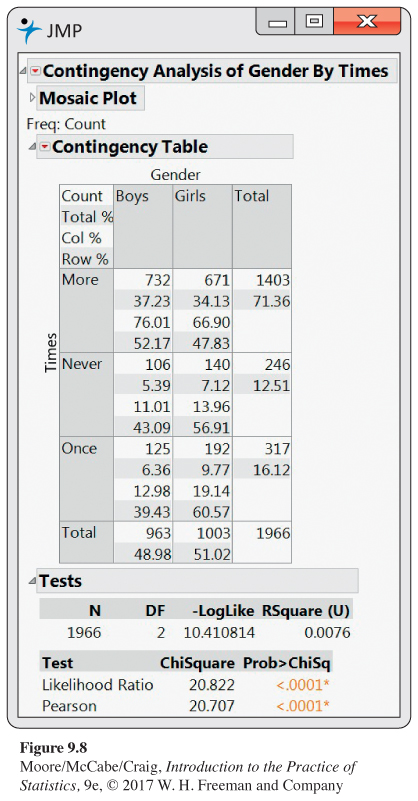
9.25 Sexual harassment in middle and high schools. A nationally representative survey of students in grades 7 to 12 asked about the experience of these students with respect to sexual harassment.6 One question asked how many times the student had witnessed sexual harassment in school. The two-
Question 9.26
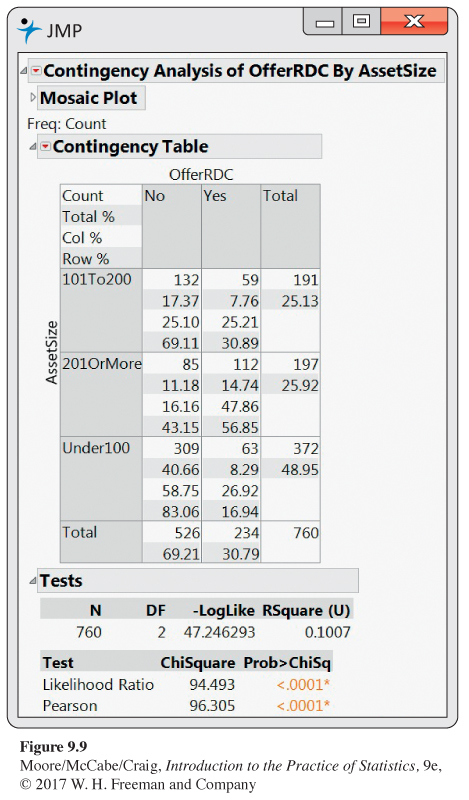
9.26 Remote deposit capture. The Federal Reserve has called remote deposit capture (RDC) “the most important development the [U.S.] banking industry has seen in years.’’ This service allows users to scan checks and to transmit the scanned images to a bank for posting.7 In its annual survey of community banks, the American Bankers Association asked banks whether or not they offered this service.8 The two-
Question 9.27
9.27 Sexual harassment in middle and high schools. Refer to Exercise 9.25. Use the output in Figure 9.8 to find the chi-
Question 9.28
9.28 Remote deposit capture. Refer to Exercise 9.26. Use the output in Figure 9.9 to find the chi-
545