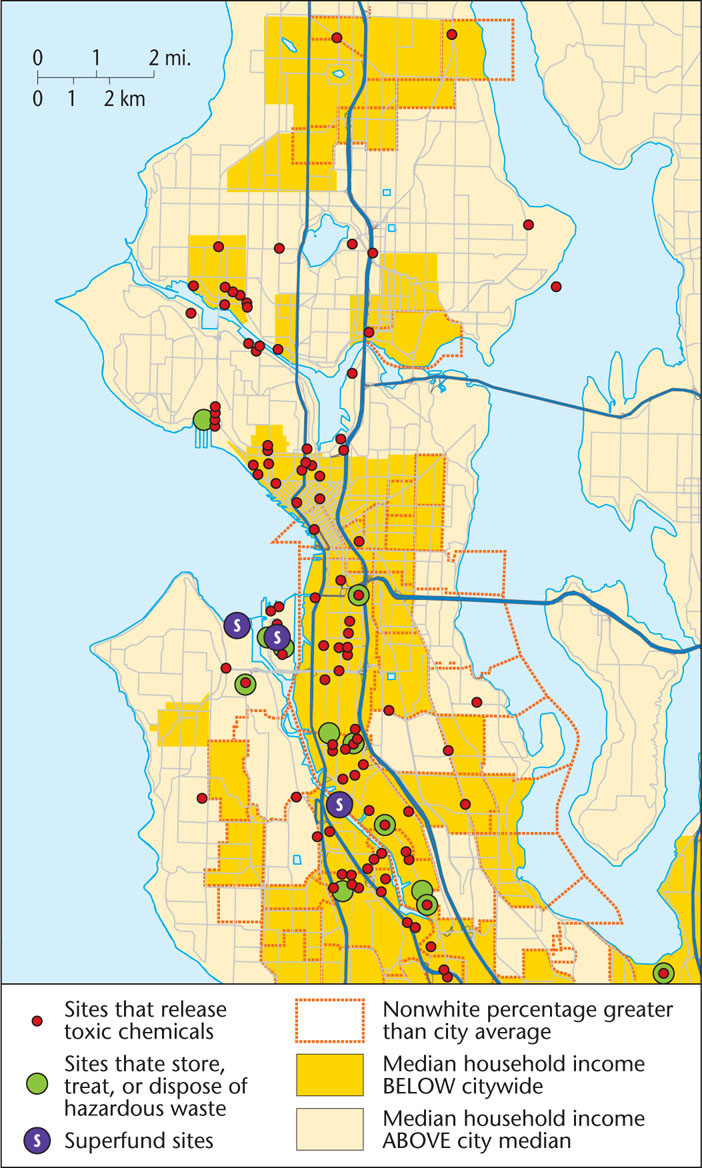
Figure 5.25: Environmental racism in the Seattle area. This map illustrates how toxic sites are distributed unevenly amongst Seattle communities. Within the city, nonwhites and low-income persons live in the most polluted environments, while white residents and the more affluent have much safer and cleaner surroundings.
(Source: King County GIS Center.)