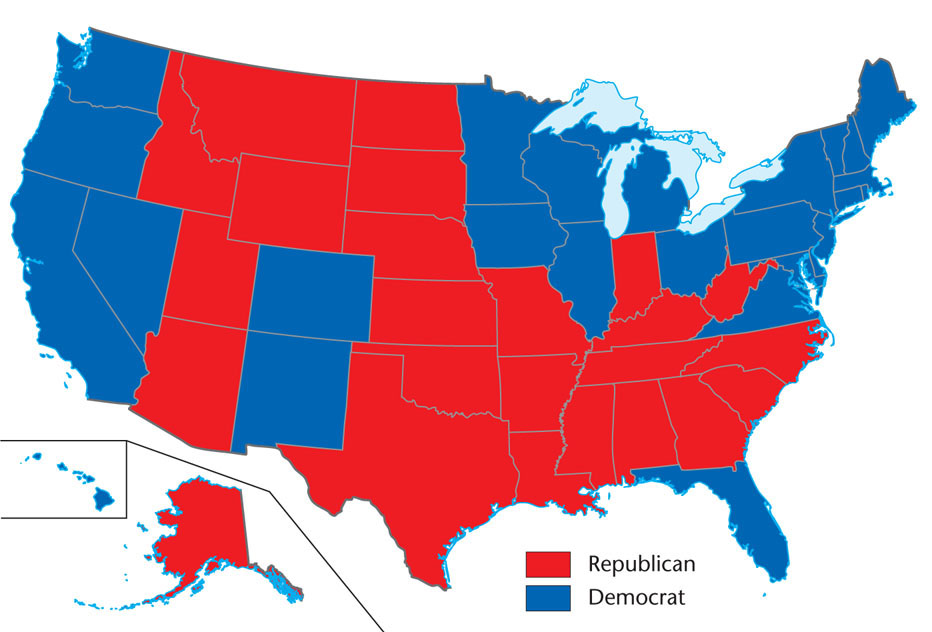
Figure 6.8: The 2012 presidential election results. In their result maps, news media have adopted a standard color-coding scheme for political parties: red for Republican, blue for Democrat. It is now common to see maps of the United States being politically and culturally classified into “red state” and “blue state” regions.